• This Forum is for adults 18 years of age or over. By continuing to use this Forum you are confirming that you are 18 or older. No content shall be viewed by any person under 18 in California.

Litz and Cortina - follow up on barrel tuner discussion

Consecutive free throws do follow a bell cure. By not mapping consecutive misses, you make the left portion of the bell curve invisible. You can easily shoot poorly enough that the middle of the bell curve is in the negative portion of the graph that you have not mapped. You don’t get to cut the bell curve in half, and then declare that because it only slopes downward on one side that it isn’t a bell curve. It is a bell curve, and your chosen to ignore one side of it. Graphing consecutive misses as negative hits makes the rest of the bell curve visible. There’s a peak in the middle, and it turns downward on both the positive and negative sides, and neither sides ever reaches zero, because if you performed the free throw an infinite number of times, you have a portion of the infinity sequence in which you missed an infinite number of times, and you would have a portion of the sequence in which you hit an infinite number of consecutive times. The Y axis of the graph represents the percentage of the sequence that you hit or missed X number consecutively. Yes you can consecutively hit infinitely, and consecutively miss infinitely, and still be within the bounds of the infinite sequence. Infinity fits into infinity an infinite number of times, but you can still derive percentages and distributions from that.

Consecutive misses wouldn’t be something we are interested in graphing though. First, consecutive misses are something we could make as high an incidence as we chose, because we can guarantee misses if we wanted them, just like we can shoot bad groups or miss the target. There is no statistical value in measuring something susceptible to a certain outcome. Secondly, intentionally running up a string of misses does not reveal how many hits a good shooter is actually capable of making.

But more importantly, if they were considered important, in my example, misses were already a trapped and accounted for value. Every time the shooter missed a free throw, he had to start over, and the premise was that he statistically was capable of reaching a certain number of hits consecutively, half of the time he began shooting. My logical conclusion is that the other half of the times that he does not reach that number, an easier number to hit, 1, 2, 3, 4, not a harder number, is going to dominate that half of his tries.

A bell curve is simply not applicable to everything we do. If you could hit 5 half the times you began, then it would suggest that you can shoot 4 and 6 consecutive free throws equally frequently. And 3 and 7. This does not comport with experience. But if you made misses the opposite side of a bell curve, you’d still have a constant downward slope on consecutive hit ability.
Actually misses that were made when trying to hit the target are perfectly valuable. They are equally valuable as hits. That’s why you should graph them. Intentional misses aren’t what you’re testing. Saying I can just slam on the breaks during a dyno test doesn’t make dyno tests invalid, but it does throw something in that isn’t being tested, and it ruins THAT test. Misses don’t count because I CAN miss on purpose? Would you seriously shoot a bad group while testing seating depth and say “bad groups don’t count because I can shoot a bad group on purpose”? No you wouldn’t. If you graphed accidental misses as negative hits you would get a bell curve. If you simply ignore them, then you will get the positive portion of a bell curve. Draw a bell curve with a pen. Grab a sheet of paper and hold it so that the edge is vertical and cover part of the bell curve. Now slide it left and right. Imagine that the paper which covers the curve is X=0. That is what you’re doing when you ignore misses. You’re not changing the curve. You’re hiding a portion of it. It’s still a bell curve.

They weren’t PROPERLY accounted for, because instead of counting them the same as hits, you “started over”. It’s the same string of shots, but viewed from a different angle. You didn’t actually “start over”. You kept shooting. You just chose to graph them improperly.

YES!!!! If your bell curve was centered on 5 consecutive successful free throws, you would hit 4 consecutive and 6 consecutive with equal frequency!!!! You just don’t believe it, and thus choose to say that it’s wrong.

Not everything follows a bell curve, but most things do.

Stop arguing with me and do some google-fu. If that proves me to be wrong by more than some minor semantics, then tell me so. I’m embarrassingly rusty with my statistics, and this thread has got me wanting to do some serious review. If on the other hand, you gain a grasp of the most neglected portion of mathematics, your entire life will benefit. Statistics are as real and as solid as 2+2, but they’re under taught and poorly understood.
 
Last edited:
Actually misses that were made when trying to hit the target are perfectly valuable. They are equally valuable as hits. That’s why you should graph them. Intentional misses aren’t what you’re testing. Saying I can just slam on the breaks during a dyno test doesn’t make dyno tests invalid, but it does throw something in that isn’t being tested, and it ruins THAT test. Misses don’t count because I CAN miss on purpose? Would you seriously shoot a bad group while testing seating depth and say “bad groups don’t count because I can shoot a bad group on purpose”? No you wouldn’t. If you graphed accidental misses as negative hits you would get a bell curve. If you simply ignore them, then you will get the positive portion of a bell curve. Draw a bell curve with a pen. Grab a sheet of paper and hold it so that the edge is vertical and cover part of the bell curve. Now slide it left and right. Imagine that the paper which covers the curve is X=0. That is what you’re doing when you ignore misses. You’re not changing the curve. You’re hiding a portion of it. It’s still a bell curve.

They weren’t PROPERLY accounted for, because instead of counting them the same as hits, you “started over”. It’s the same string of shots, but viewed from a different angle. You didn’t actually “start over”. You kept shooting. You just chose to graph them improperly.

YES!!!! If your bell curve was centered on 5 consecutive successful free throws, you would hit 4 consecutive and 6 consecutive with equal frequency!!!! You just don’t believe it, and thus choose to say that it’s wrong.

Not everything follows a bell curve, but most things do.

Stop arguing with me and do some google-fu. If that proves me to be wrong by more than some minor semantics, then tell me so. I’m embarrassingly rusty with my statistics, and this thread has got me wanting to do some serious review. If on the other hand, you gain a grasp of the most neglected portion of mathematics, your entire life will benefit. Statistics are as real and as solid as 2+2, but they’re under taught and poorly understood.


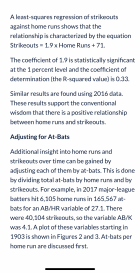
Here’s your example straight from the internet, as requested. There is zero statistical symmetry between the hardest outcome and the easiest outcome of professional baseball batters with stellar batting averages, none of whom tried to strike out on purpose. You can strike out, hit out, walk, hit to three bases, or hit a home run. That’s all the choices there are. Zero symmetry. A bell curve isn’t a natural law.
 

Attachments

  • 1683430665392.png
    1683430665392.png
    1 MB · Views: 14
This is quite the interesting argument. I'm entertained by the ruminations.

Question for those that acknowledge that statistical significance would take too many rounds to accomplish:

How many rounds does it take to tell if setting X is better than, worse than or the same as setting Y in terms of precision? I'm not asking for 100% certainty. Give me something like 90 or 95%... Assume one setting has a population mean radius of .3 MOA and the other setting has a mean radius of .2 MOA at 1000 yards. I want to know how many sighters I need to take.

(Hint: It's a trap!)

On a different note, I reject the assertion that Litz found that tuners don't work. That is a clear misinterpretation of the data and findings. I read his work and came away understanding that the testing methodology prescribed by the manufacturer didn't work, and therefore made determination of viability impossible. Litz isn't dumb, he's thorough. He even tried some things outside of the dogma to see if he could improve upon the testing protocols prescribed (i.e. zonal/sweep testing).

I wish Litz would work with Mike Ezell. It would be entertaining to see the difference between a vibration dampener and a loosely threaded nut. I'd wager that the outcome of that testing would be significantly different. I'd buy the book.

If you want to entertain yourselves, go buy some shaft collars and hang a few on a barrel. It is enlightening how it changes the POI and group size. I won't spoil that one for you. I've gone as heavy as 1 lb on an F-class rifle.

My record in F-class is available for everyone to see (look closely at who landed above and below me). Maybe I did well because I was watching the wind. I have won far too many matches without load development or tuner. The secret is to use the same load and same chamber in every barrel. The starting point can be the ending point in the majority of cases. It's not magic, except for the wind calling.
 
+1
It would be great to have Mike and Eric direct the procedures and shooting.

The performance stats are not going to be the problem cause we will let the folks with skin in the game determine the goals. In the best outcome, another capable participant would then repeat the test and get a good outcome.

It would also be good to have a rimfire participant in parallel. Here again, getting the demonstration of what happens as climate takes factory ammo out of tune and improving this with a tuner would be the fat lady singing wouldn't it?!?
 
Here’s your example straight from the internet, as requested. There is zero statistical symmetry between the hardest outcome and the easiest outcome of professional baseball batters with stellar batting averages, none of whom tried to strike out on purpose. You can strike out, hit out, walk, hit to three bases, or hit a home run. That’s all the choices there are. Zero symmetry. A bell curve isn’t a natural law.
What part of the posted screenshot makes you think that batters don’t produce a normal distribution in their results? Was there something in the article that isn’t included? Maybe batters don’t produce results that follow a normal distribution, but it wouldn’t surprise me if they do. The complexity of baseball compared to free throws is such that the sample size required to prove something would be an awful lot higher. Batters don’t face the same pitcher at every at bat. The pitcher doesn’t pitch the same pitch, at the same location, or at the same velocity on every pitch. I mean you’re talking something exponentially more complicated than putting ball through a stationary hoop from the exact same position every time. Even so, I would be surprised if hitting baseballs didn’t follow a normal distribution.

Symmetry doesn’t equal zero being the midpoint by the way.

Spend some time understanding the actual statistics and how to interpret them rather than finding something that doesn’t follow a normal distribution. Not everything does. That’s not the point of applying some basic statistics to your load development.
 
Last edited:
I’m the one that’s been saying that skill based outcomes are sloping lines, not symmetrical bell curves. It sounds like you’re thinking about my example, and then telling me now to stop thinking everything falls under a bell curve ;).

I can’t research the outcomes of at bats because I’m driving to a match, but as long as the outcomes are arranged by the same logic that we have been talking about in group sizes, I’m open to seeing what real numbers people find and plug in.

The logic utilized in the group size discussions has been average size in the middle with smaller and smaller groups to the right, and bigger and bigger groups to left, - no incongruent skipping around - which is the order of increasing shot quality.

By my thinking, this means at bat outcomes need to be lined up as follows, which is the order of effective batting from worst to best. No skipping around to stick the most numerous outcome in the middle bordered by whatever is the next most frequent, regardless of skill incongruency.

Strike out / hit out / walk / single / double / triple / home run.

I’m going to guess here there is a huge numerical left side bias, and a line sloping generally downward, left to right, like I hypothesized on how people hit consecutive free throws, and how I think they shoot groups.
 
Last edited:
This is quite the interesting argument. I'm entertained by the ruminations.

Question for those that acknowledge that statistical significance would take too many rounds to accomplish:

How many rounds does it take to tell if setting X is better than, worse than or the same as setting Y in terms of precision? I'm not asking for 100% certainty. Give me something like 90 or 95%... Assume one setting has a population mean radius of .3 MOA and the other setting has a mean radius of .2 MOA at 1000 yards. I want to know how many sighters I need to take.

(Hint: It's a trap!)

On a different note, I reject the assertion that Litz found that tuners don't work. That is a clear misinterpretation of the data and findings. I read his work and came away understanding that the testing methodology prescribed by the manufacturer didn't work, and therefore made determination of viability impossible. Litz isn't dumb, he's thorough. He even tried some things outside of the dogma to see if he could improve upon the testing protocols prescribed (i.e. zonal/sweep testing).

I wish Litz would work with Mike Ezell. It would be entertaining to see the difference between a vibration dampener and a loosely threaded nut. I'd wager that the outcome of that testing would be significantly different. I'd buy the book.

If you want to entertain yourselves, go buy some shaft collars and hang a few on a barrel. It is enlightening how it changes the POI and group size. I won't spoil that one for you. I've gone as heavy as 1 lb on an F-class rifle.

My record in F-class is available for everyone to see (look closely at who landed above and below me). Maybe I did well because I was watching the wind. I have won far too many matches without load development or tuner. The secret is to use the same load and same chamber in every barrel. The starting point can be the ending point in the majority of cases. It's not magic, except for the wind calling.
95% is the standard threshold for statistical significance. It’s an arbitrary level. You can place your own level wherever you want. As far as how many sighters you need, you didn’t give enough information(is that the trap you’re referring to?), but you’d need more sighters than you’d want to shoot in a match to prove that one setting was better than another setting. Now that isn’t to say that it isn’t possible for prior experience with a tuner to have some carry over. I don’t have enough experience with such a thing to know. If you needed to prove such a thing with statistics, you would include shooting outside of the match in the sample size to prove that the changes you made were significant, and if it’s proven that turning a tuner in a certain direction causes a certain change, then you can use that data during the match with sample sizes that are too small to prove anything and you can get the proven result. I hope I haven’t gotten anything too wrong, as I’m horribly rusty at statistics, but it seems like most posters in this thread would answer a lot of coin flip problems incorrectly.

I didn’t watch the video, so I have no idea what Litz did.

Why would a loosely thread nut not be a form of vibration damper? It should dampen vibration. Perhaps I’m missing something.

I’m not surprised that you’ve done well by carrying the same load from barrel to barrel. Most of the minor changes in loads that lead to minor changes in groups seem not to provably do anything. You wouldn’t be the first person to succeed with minimal tuning efforts. It seems to me that if you can’t prove that a change did something in a single barrel, and then the next barrel seems to want something different, that you’re left with two options. A) There isn’t actually a problem that needs to be solved or B) the problem is unsolvable. The solution is the same either way. Stop trying to solve the dang problem. Take the first load that gives you decent results and roll with it. That said, it’s possible that shooting the same profile barrel with the same chamber could have some level of carryover. If that’s the case then suddenly your sample size is larger than what can be tested within a single barrel. It’s my opinion that through vast experience some shooters have picked up on some things are useful but can’t be mathematically proven in a low number of test shots. That doesn’t mean that statistics wouldn’t back them up, it just means that they may not have documented the statistics that would back them up, and a few short shot strings isn’t enough. I do think that happens. I also think that some of the very same shooters pick up on things that were totally random and assign them value. The resulting mixture of fact and fiction leads to the various forms of witchery common among short range benchrest shooters. That’s also why it doesn’t surprise me when some shooters seem to do just as well with simple methods as the shooters who sacrifice a goat between relays.

I don’t know if this has anything to do with tubers, and I haven’t analyzed it statistically. In my limited experience I felt like a good tune at 100yds was not always good at 200yds, but a good tune at 200yds was always just as good at 100yds. Still, that 200yd tune that was good at 100, might not be as good as the 100yd tune that sucked at 200. I haven’t sat down to see if that is fact or fiction, but I have encountered others with similar experience. When I started shooting F-class, I felt like getting a good low SD/ES seemed to equal a good tune. A good tune might have poor SD/ES and shoot great at 100, but awful at 500/600/800/900/1000, but a good low SD/ES shot pretty good at all ranges. If that’s true and not a random phenomenon, AND if tuners do the same thing that tuning does, then it seems to me like tubers might be useful at short range and completely worthless at long range. Just a thought.
 
What part of the posted screenshot makes you think that batters don’t produce a normal distribution in their results? Was there something in the article that isn’t included? Maybe batters don’t produce results that follow a normal distribution, but it wouldn’t surprise me if they do. The complexity of baseball compared to free throws is such that the sample size required to prove something would be an awful lot higher. Batters don’t face the same pitcher at every at bat. The pitcher doesn’t pitch the same pitch, at the same location, or at the same velocity on every pitch. I mean you’re talking something exponentially more complicated than putting ball through a stationary hoop from the exact same position every time. Even so, I would be surprised if hitting baseballs didn’t follow a normal distribution.

Symmetry doesn’t equal zero being the midpoint by the way.

Spend some time understanding the actual statistics and how to interpret them rather than finding something that doesn’t follow a normal distribution. Not everything does. That’s not the point of applying some basic statistics to your load development.

The only thing cut off, was that the formula applied to the > .400 batters, which means the massive asymmetry at the ends, that negates a “normal” bell curve distribution, is even more pronounced for the other pros, than the formula suggests.

***** misread small screen while driving late. There was no decimal point. The > 400 was the size of the set of surveyed batters. *****
 
Last edited:
I’m the one saying that’s been saying that skill based outcomes are sloping lines, not symmetrical bell curves. It sounds like you’re thinking about my example, and then telling me now to stop thinking everything falls under a bell curve ;).

I can’t do research the outcomes of at bats because I’m driving to a match, but as long as the outcomes are arranged by the same logic that we have been talking about in group sizes, I’m open to seeing what real numbers people find and plug in.

The logic utilized in the group size discussions has been average size in the middle with smaller and smaller groups to the right, and bigger and bigger groups to left, - no incongruent skipping around - which is the order of increasing shot quality.

By my thinking, at means at bat outcomes need to be lined up as follows, which is the order of effective batting from worst to best.

Strike out / walk / single / double / triple / home run.

I’m going to guess here there is a huge left side bias, and a line sloping generally downward, left to right, like I hypothesized on how people hit free throws, and how I think they shoot groups.
Lots of skill based things fall under a bell curve. Also, how you arrange the data can affect how you draw the graph, but it doesn’t change the data. Just as you chose to evaluate free throws in a way that would hide part of the bell curve, you can evaluate batting in a way that hides the bell curve. I suspect that batting outcomes follow a bell curve. I also suspect that how you look at those outcomes can allow you trick yourself with your graph. Look at how you organized your batting outcomes. While you might consider a walk to be only a slightly greater accomplishment than a strikeout, and slightly lesser accomplishment than a single, that’s a horrible means by which to categorize it. The criteria for a walk aren’t very closely related to that of a single. It’s possible to hit a single, double, triple or home run on the first pitch, but impossible to get a base on balls via a single pitch. You didn’t specify hit-by-pitch, or intentional walks, which both totally convolute that single category our outcome. Also, in order to get a walk, you have to avoid getting three strikes in the process of getting four bad pitches. Your bullet isn’t trying to outsmart you, and either is the hoop on a basketball goal. There also aren’t nine people trying to field your free throw, and they aren’t nine different people in each different game. I’m still not sure batting outcomes wouldn’t follow a normal distribution, but you would have to arrange outcomes differently than you have done. Consecutive out of the park homes run vs not, would probably result in a normal distribution that was centered very far into negative territory with a very low peak. Consecutive pitches which were contacted by the bat vs consecutive pitches that were not would probably be a normal distribution that was centered much closer to zero, and had a much higher peak. All three means of arranging the data would contain exactly the same data, but two would probably have clear normal distributions that were easily interpreted and one would APPEAR random even though it was not. Poorly arranged data is difficult to decipher.

The screenshot you posted had absolutely nothing to do with whether or not home runs or stikeputs were normally distributed. Unfortunately you’re misunderstanding a lot of things that a few hours in a statistics text book would clarify. I’ve forgotten an awful lot of statistics, and need to brush up on it myself. I don’t think I’m capable of properly enlightening you via an Internet forum. Someone more skilled could do a better job than I, but it’s also a more complex topic than this media is likely good for.
 
The only thing cut off, was that the formula applied to the > .400 batters, which means the massive asymmetry at the ends, that negates a “normal” bell curve distribution, is even more pronounced for all pros, than the formula suggests.
If that’s the only thing missing then what part of that makes you think they informed you of the distribution? They did not. It’s perfectly plausible that their performance followed a bell curve. Knowing their strike out to home run ratio doesn’t say anything at all about whether or not their performance follows a normal distribution. You’re misunderstanding some things.

Was the greater than .400 a slugging percentage instead of battling average? While I don’t follow professional baseball closely, I thought Ted Williams was the last player to hit .400+ for a season. It still doesn’t matter. That only shifts the bell curve, it doesn’t make it not a bell curve. It would still be symmetrical too. You seem to think that symmetry involves being centered on zero, but it does not. Maybe I’m just misunderstanding you.

Somehow this has devolved into a guy who doesn’t understand statistics at all arguing with a guy who has forgotten too much about statistics to teach you. Surely the economist could do a better job than I.
 
Last edited:
Lots of skill based things fall under a bell curve. Also, how you arrange the data can affect how you draw the graph, but it doesn’t change the data. Just as you chose to evaluate free throws in a way that would hide part of the bell curve, you can evaluate batting in a way that hides the bell curve. I suspect that batting outcomes follow a bell curve. I also suspect that how you look at those outcomes can allow you trick yourself with your graph. Look at how you organized your batting outcomes. While you might consider a walk to be only a slightly greater accomplishment than a strikeout, and slightly lesser accomplishment than a single, that’s a horrible means by which to categorize it. The criteria for a walk aren’t very closely related to that of a single. It’s possible to hit a single, double, triple or home run on the first pitch, but impossible to get a base on balls via a single pitch. You didn’t specify hit-by-pitch, or intentional walks, which both totally convolute that single category our outcome. Also, in order to get a walk, you have to avoid getting three strikes in the process of getting four bad pitches. Your bullet isn’t trying to outsmart you, and either is the hoop on a basketball goal. There also aren’t nine people trying to field your free throw, and they aren’t nine different people in each different game. I’m still not sure batting outcomes wouldn’t follow a normal distribution, but you would have to arrange outcomes differently than you have done. Consecutive out of the park homes run vs not, would probably result in a normal distribution that was centered very far into negative territory with a very low peak. Consecutive pitches which were contacted by the bat vs consecutive pitches that were not would probably be a normal distribution that was centered much closer to zero, and had a much higher peak. All three means of arranging the data would contain exactly the same data, but two would probably have clear normal distributions that were easily interpreted and one would APPEAR random even though it was not. Poorly arranged data is difficult to decipher.

The screenshot you posted had absolutely nothing to do with whether or not home runs or stikeputs were normally distributed. Unfortunately you’re misunderstanding a lot of things that a few hours in a statistics text book would clarify. I’ve forgotten an awful lot of statistics, and need to brush up on it myself. I don’t think I’m capable of properly enlightening you via an Internet forum. Someone more skilled could do a better job than I, but it’s also a more complex topic than this media is likely good for.

I did not include stealing first on dropped strike three pitch or intentional walks because they are extremely rare and have less to do with the batter’s skill.

I agree that some skill, and a great many other types of outcomes do follow the distribution pattern of a bell curve. So many in fact, that people have generally stopped trying to analytically discern whether one really applies to a certain outcome.

I would add that if we are going to call something a bell curve, it really needs to approximate that general shape. It would be inappropriate to permit one side to be multiples of the other, or to change direction to “up” again so as to create a second bell, or to really be nothing more than an irregular slope, and so on, while still maintaining that it’s normal bell curve distribution.

I wasn’t hiding part of the bell curve on missed free throws. In fact, to make that point very clear and decisive, the analogy is exactly the same if the parameter is simply that the number of “consecutive free throws is defined to begin when the first one is made and end when the last one is made.” I know that you know that nothing whatsoever changes. Misses are and were always immaterial to the point, and a red herring. I was focusing on the assertion that as skill increased in order to successfully perform a more and more difficult task, the incidence of its accomplishment decreases, thus the stipulation that the free throws be made consecutively.

**** I am aware that one causal type of basketball game penalizes you for misses and gives you nothing for shots made, such that you lose on the last letter. That is the only context where misses are tracked or matter. Nothing being discussed had anything to do with that. “Negative shots” reference of yours appertained to nothing being discussed. ****
 
Last edited:
This is quite the interesting argument. I'm entertained by the ruminations.

Question for those that acknowledge that statistical significance would take too many rounds to accomplish:

How many rounds does it take to tell if setting X is better than, worse than or the same as setting Y in terms of precision? I'm not asking for 100% certainty. Give me something like 90 or 95%... Assume one setting has a population mean radius of .3 MOA and the other setting has a mean radius of .2 MOA at 1000 yards. I want to know how many sighters I need to take.

(Hint: It's a trap!)

On a different note, I reject the assertion that Litz found that tuners don't work. That is a clear misinterpretation of the data and findings. I read his work and came away understanding that the testing methodology prescribed by the manufacturer didn't work, and therefore made determination of viability impossible. Litz isn't dumb, he's thorough. He even tried some things outside of the dogma to see if he could improve upon the testing protocols prescribed (i.e. zonal/sweep testing).

I wish Litz would work with Mike Ezell. It would be entertaining to see the difference between a vibration dampener and a loosely threaded nut. I'd wager that the outcome of that testing would be significantly different. I'd buy the book.

If you want to entertain yourselves, go buy some shaft collars and hang a few on a barrel. It is enlightening how it changes the POI and group size. I won't spoil that one for you. I've gone as heavy as 1 lb on an F-class rifle.

My record in F-class is available for everyone to see (look closely at who landed above and below me). Maybe I did well because I was watching the wind. I have won far too many matches without load development or tuner. The secret is to use the same load and same chamber in every barrel. The starting point can be the ending point in the majority of cases. It's not magic, except for the wind calling.
If you joined us, we could cover a lot of ground and get it into the public eye. Just think, we'd have one person with significant tuner experience, our own publisher and a videographer. I'd entertain the idea of working with you both.
 
I did not include stealing first on dropped strike three pitch or intentional walks because they are extremely rare and have less to do with the batter’s skill.

I agree that some skill, and a great many other types of outcomes do follow the distribution pattern of a bell curve. So many in fact, that people have generally stopped trying to analytically discern whether one really applies to a certain outcome.

I would add that if we are going to call something a bell curve, it really needs to approximate that general shape. It would be inappropriate to permit one side to be multiples of the other, or to change direction to “up” again so as to create a second bell, or to really be nothing more than an irregular slope, and so on, while still maintaining that it’s normal bell curve distribution.

I wasn’t hiding part of the bell curve on missed free throws. In fact, to make that point very clear and decisive, the analogy is exactly the same if the parameter is simply that the number of “consecutive free throws is defined to begin when the first one is made and end when the last one is made.” I know that you know that nothing whatsoever changes. Misses are and were always immaterial to the point, and a red herring. I was focusing on the assertion that as skill increased in order to successfully perform a more and more difficult task, the incidence of its accomplishment decreases, thus the stipulation that the free throws be made consecutively.

**** I am aware that one causal type of basketball game penalizes you for misses and gives you nothing for shots made, such that you lose on the last letter. That is the only context where misses are tracked or matter. Nothing being discussed had anything to do with that. “Negative shots” reference of yours appertained to nothing being discussed. ****
Misses are entirely material to the point. By only counting baskets, you only look at part of the data. But you don’t not miss. When you hide the part of the data that is misses, you hide the portion of the bell curve that is left of hits. The bell curve is symmetrical. It looks perfectly like a bell curve. Just because the portion of the curve that you make visible isn’t the midpoint, doesn’t meant the curve doesn’t look exactly like a bell curve. The portion of the data that is left of hits could be the center, if the player’s performance was exactly equal at missing baskets compared to making baskets. If the player misses more baskets than he makes, the center of the bell is left of zero. If a player makes more baskets than he misses. Then the center of the bell is right of zero. The bell still looks perfectly like a bell. It’s perfectly symmetrical about its center. It’s not symmetric about x=0. If you hide the portion of the data that is left of X=0(which is what you do when you don’t graph misses)then the only part of the bell that is visible is right of zero. It’s still a bell curve. It still looks exactly like a bell curve, it just happens to look exactly like a portion of the curve has been hidden or cut off, and that’s exactly what’s been done. You’ve clearly not done one of the things I suggested to help you visualize it. Draw a bell curve. Hold a piece of paper over it with the edge vertical. Slide the paper left and right covering different portions of the bell curve. The visible portion is not symmetric to invisible portion, but the bell curve is symmetric about its center, which is not always centered at X=0. You continue to insist that the “left side” would be higher than the “right side” in my examples, but that would only occur if you didn’t draw the line defining the sides in the middle. It’s a shame I can’t show you what I’m talking about on paper.

Graphing the outcome of hitting or missing free throws is almost identical to flipping a coin except for two minor complications. The first difference is that the coin flip is centered on zero, but the skilled throwing moves the entire bell left or right. It remains symmetrical, but its center is not at zero. The hit is heads, the miss is tails. You’re only counting heads and then saying that because the left side is missing, it isn’t a bell curve. By graphing tails, you would immediately agree that it was a bell curve. Somehow with free throws not being centered on zero, that complication(which doesn’t change the shape of the curve at all) is making it harder for you to see that the exact same bell is there. Do the exercise. Cover part of a bell curve and look at it. That’s what you’re doing when you ignore some of the data. And it isn’t necessarily half of the data. The portion of the curve that is left of zero is determined by the skill of the player. The second complication is that the height of the bell(which remains a bell) is determined by how consistently the player achieves his average outcome. Two players average is seven consecutive free throws made. One makes his seven free throws 50% of the time. His bell peaks at Y=50, and is narrow. The other player hits his average of seven only 25% of the time. His bell peaks at Y=25 and slopes down more gradually than the first player. Both curves are bells. Both are symmetric about X=7. The area under both bells is 100(which happens to be the percentage of the shots that you graphed if you include misses). The shooter that hits seven consecutive throws 25% of the time hits six and eight more often than the shooter that hits seven consecutive 50% of the time. Why? Because if that wasn’t true, then they wouldn’t both have an average of seven consecutive throws. You see the first shooter isn’t entirely better than the second. They both had the same average. If you had two shooters who hit their average number of consecutive free throws 25% of the time, but one shooter’s average was six consecutive shots, and the other’s was eight consecutive shots, then the two bells would be completely identical in shape(height is Y=25), except they would be centered on X=6 for one and X=8 for the other.


You’re misunderstanding over, and over, and over. Perhaps I am not the person to explain this to you. Perhaps this is a poor medium by which to attempt to explain. I’m not a teacher. I’m really trying. You’d be much better served by cracking open a text book on statistics.
 
Last edited:
OBT works, not because of the effect on muzzle diameter according to Long but because the energy wave moving longitudinally at the speed of sound also causes a vertical transverse vibration at the muzzle at the same frequency which results in the positive compensation phase shift to facilitate tuning. Kolbe demonstrated this phase shift , not frequency or amplitude, as positive compensation when a tuner was added. These are different manifestations of the same thing.

Group size is the same thing as the statistical range. It is not normally distributed, but may be reasonably represented as such at times. The individual shots are the observations; group size (range) is a statistic which is highly dependent on sample size. The range is a surrogate to estimate the SD, so what is the SD of the SD; I don't know as I've never observed that as a concept? The shot radius statics, mean and SD, now we're getting somewhere!
 
Does a tuner change the shape of a group every day or just some days ?

I think you guys are too deep into the weeds with the stats and need for large sample sizes, you need 5 record rounds’ that’s all, just five.
 
Last edited:
Group size is the same thing as the statistical range. It is not normally distributed, but may be reasonably represented as such at times. The individual shots are the observations; group size (range) is a statistic which is highly dependent on sample size. The range is a surrogate to estimate the SD, so what is the SD of the SD; I don't know as I've never observed that as a concept? The shot radius statics, mean and SD, now we're getting somewhere!
I’m not saying you’re wrong. I’m too rusty to plant a stake in the ground against your position. But I see no reason why it would be invalid to take the SD of a group of SDs. However, you’re exactly making one of my points. That point being that group size is an inefficient way to evaluate a small number of shots. Ten five shot groups requires fifty shots, but you’re basically only generating ten data points. You could look at the same fifty shots, and analyze them differently, like distance from center or X-Y coordinates, and generate fifty data points. The data is the same, but the resolution would be better.

Because I see no reason that you can’t take an SD of a group of SD’s and get a result that bad meaning, even if you didn’t know what to call it, I also think that if you plotted an infinite number of groups, shot by the same shooter, using the same load, in a barrel that never wears, and then you graphed the percentage of the time a group was a certain size for every size group that he shot, that you would get a normal distribution that looked like a bell curve that was symmetric across his average group size. If that’s the case, and I see no reason why it wouldn’t be, then you can apply it to the real world. A shooter can take the measurement of a sample of groups with the same load, and generate an SD if group size. Then he can make a change in his load and calculate the probability that the change in grouo size was due to the change in load or the fact that he doesn’t shoot groups that are all the same size. And he doesn’t actually have to start over with each barrel. He can go through a log book of groups, and compare his current load and gun to his past performance. He can examine match results from last week, and go shoot a group, and see what probability there is that he is shooting in what percentile of the pack.

This is actually what experience shooters are doing, they’re just doing it by feel instead of by numbers. Numbers can give them better resolution than their feel does.
 
Misses are entirely material to the point. By only counting baskets, you only look at part of the data. But you don’t not miss. When you hide the part of the data that is misses, you hide the portion of the bell curve that is left of hits. The bell curve is symmetrical. It looks perfectly like a bell curve. Just because the portion of the curve that you make visible isn’t the midpoint, doesn’t meant the curve doesn’t look exactly like a bell curve. The portion of the data that is left of hits could be the center, if the player’s performance was exactly equal at missing baskets compared to making baskets. If the player misses more baskets than he makes, the center of the bell is left of zero. If a player makes more baskets than he misses. Then the center of the bell is right of zero. The bell still looks perfectly like a bell. It’s perfectly symmetrical about its center. It’s not symmetric about x=0. If you hide the portion of the data that is left of X=0(which is what you do when you don’t graph misses)then the only part of the bell that is visible is right of zero. It’s still a bell curve. It still looks exactly like a bell curve, it just happens to look exactly like a portion of the curve has been hidden or cut off, and that’s exactly what’s been done. You’ve clearly not done one of the things I suggested to help you visualize it. Draw a bell curve. Hold a piece of paper over it with the edge vertical. Slide the paper left and right covering different portions of the bell curve. The visible portion is not symmetric to invisible portion, but the bell curve is symmetric about its center, which is not always centered at X=0. You continue to insist that the “left side” would be higher than the “right side” in my examples, but that would only occur if you didn’t draw the line defining the sides in the middle. It’s a shame I can’t show you what I’m talking about on paper.

Graphing the outcome of hitting or missing free throws is almost identical to flipping a coin except for two minor complications. The first difference is that the coin flip is centered on zero, but the skilled throwing moves the entire bell left or right. It remains symmetrical, but its center is not at zero. The hit is heads, the miss is tails. You’re only counting heads and then saying that because the left side is missing, it isn’t a bell curve. By graphing tails, you would immediately agree that it was a bell curve. Somehow with free throws not being centered on zero, that complication(which doesn’t change the shape of the curve at all) is making it harder for you to see that the exact same bell is there. Do the exercise. Cover part of a bell curve and look at it. That’s what you’re doing when you ignore some of the data. And it isn’t necessarily half of the data. The portion of the curve that is left of zero is determined by the skill of the player. The second complication is that the height of the bell(which remains a bell) is determined by how consistently the player achieves his average outcome. Two players average is seven consecutive free throws made. One makes his seven free throws 50% of the time. His bell peaks at Y=50, and is narrow. The other player hits his average of seven only 25% of the time. His bell peaks at Y=25 and slopes down more gradually than the first player. Both curves are bells. Both are symmetric about X=7. The area under both bells is 100(which happens to be the percentage of the shots that you graphed if you include misses). The shooter that hits seven consecutive throws 25% of the time hits six and eight more often than the shooter that hits seven consecutive 50% of the time. Why? Because if that wasn’t true, then they wouldn’t both have an average of seven consecutive throws. You see the first shooter isn’t entirely better than the second. They both had the same average. If you had two shooters who hit their average number of consecutive free throws 25% of the time, but one shooter’s average was six consecutive shots, and the other’s was eight consecutive shots, then the two bells would be completely identical in shape(height is Y=25), except they would be centered on X=6 for one and X=8 for the other.


You’re misunderstanding over, and over, and over. Perhaps I am not the person to explain this to you. Perhaps this is a poor medium by which to attempt to explain. I’m not a teacher. I’m really trying. You’d be much better served by cracking open a text book on statistics.
+ a bunch for patience!
 
Does a tuner change the shape of a group every day or just some days ?

I think you guys are too deep into the weeds with the stats and need for large sample sizes, you need 5 record rounds’ that’s all, just five.
Every day, as it's changing what is essentially a constant with each mark by its respective value. But the need to move it is a different story. Some days the gun will hold tune all day, while others, it does not, even over the same temp swing. I believe this is due to air density. Bottom line, each mark on the tuner has a value but because air density may or may not be the same over a given temp change, there will be times that it doesn't go out of tune. Moving the tuner changes a constant where each degree is not necessarily the same from day to day. There MIGHT be more to it but temp AND air density combined are absolutely the biggest driving factors to tune.

Temps effects are easy to understand because powder turning from a solid into a gas is a chemical reaction and all chemical reactions(AFAIK) are more or less temp dependent. Why density matters to a point is harder for me to understand. I may be as simple as denser air dampening vibration more than lighter air. And...it may be something totally different but density does have a role in tune, albeit, less than temp ime.
 
Last edited:
Every day, as it's changing what is essentially a constant with each mark by its respective value. But the need to move it is a different story. Some days the gun will hold tune all day, while others, it does not, even over the same temp swing. I believe this is due to air density. Bottom line, each mark on the tuner has a value but because air density may or may not be the same over a given temp change, there will be times that it doesn't go out of tune. Moving the tuner changes a constant where each degree is not necessarily the same from day to day. There MIGHT be more to it but temp AND air density combined are absolutely the biggest driving factors to tune.
Well that’s great, at least we have that settled. Lol

Hopefully we can move on.
 

Upgrades & Donations

This Forum's expenses are primarily paid by member contributions. You can upgrade your Forum membership in seconds. Gold and Silver members get unlimited FREE classifieds for one year. Gold members can upload custom avatars.


Click Upgrade Membership Button ABOVE to get Gold or Silver Status.

You can also donate any amount, large or small, with the button below. Include your Forum Name in the PayPal Notes field.


To DONATE by CHECK, or make a recurring donation, CLICK HERE to learn how.

Forum statistics

Threads
165,796
Messages
2,203,609
Members
79,130
Latest member
Jsawyer09
Back
Top