• This Forum is for adults 18 years of age or over. By continuing to use this Forum you are confirming that you are 18 or older. No content shall be viewed by any person under 18 in California.

COVID-19 Map worldwide, with statistics

Status
Not open for further replies.
That has to be the dumbest piece of selective analysis I've ever seen for reasons that ought to be painfully obvious to even the most casual of readers.
Ah, argumentum ad incredulitatis rears it ugly head. Nice work, if you can get it.
-
 
Last edited:
That has to be the dumbest piece of selective analysis I've ever seen for reasons that ought to be painfully obvious to even the most casual of readers.

But yeah, nothing to see here. Thankfully we're way behind New York/NJ. We've learnt something. Lucky us. That was the point of buying time. The 7DMA of reported deaths continues its path upwards as does the median age of new confirmed cases but it's just a light cull (so far).
I thought cull’s were good?
 
Ah, argumentum ad incredulitatis rears it ugly head. Nice work, if you can get it.
-

Come on, you're a lot smarter than the numpty that wrote that article.

First, only an idiot reads daily disclosures of deaths as deaths occurring on that day. None of the media I read or listen to claims the figures are deaths that day. Of course there are delays in reporting and paperwork. Funny how Sunday's and Monday's figures typically take a dip as paperwork takes longer.

Second, the guy selects 4 days of reported deaths figures and then spreads them over the days of occurrence. The difference looks stark. He omits, however, to add in the prior days reporting and omits to highlight that future days' reports would layer on top of the re-allocated data.

So what's the impact of graphing each day's reported deaths versus going through the hassle of reallocating them to the particular dates of death? Nothing other than a small time shift of a couple of days at most. The trend would remain the same. The graph of reported deaths would just lag the other slightly.

This is why a 7DMA is useful. It (a) helps smooth day-to-day unevenness in reported deaths in order to view trends and (b) smooths the effect of paperwork delays' impact on reported deaths figures.

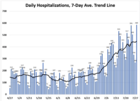
As for things being better than in NY so far, well no sh*t Sherlock. I don't think that's lost on anyone. It certainly isn't lost on people here in Miami-Dade/Broward which still has borne the brunt of COVID for FL. The 7DMA of new confirmed cases peaked in NY on April 10 at 10,059. It peaked in FL on July 17 at 11,870 but with, no doubt, the benefit of broader testing. Hospitals in South Florida were, and still are, stressed but haven't yet been completely overrun as they were in NY. They are benefitting greatly from the lockdown and delay in COVID coming to south FL. They put in place better procedures for the admission of infectious patients, trained staff, acquired more PPE, learnt best practices in patient care and are benefitting from medicines - all little tips and benefits learnt from the NE and abroad. Thankfully new case count seems to have rolled over. However, the 7DMA of hospitalisations continues to be extremely elevated and still growing. The median age of new confirmed cases has grown from mid 30s in mid-June to early 40s now (it hit 43 on Monday). The 7DMA of reported deaths is up 33% in the last 10 days. It's up almost four fold in the last month. Personally I expect it to continue to grow significantly but hopefully I am wrong. A new record for the state has just been reported.

Screen Shot 2020-07-29 at 9.58.09 AM.png

I thought cull’s were good?
[sic]

If inexpensive one could argue an economic benefit. But at what broader cost to society? Yet again, a large (economic) cost has been placed on the young in support of the old. It surprises me how ungrateful many old folk are. Anyone here particularly those over 60 should be grateful they're not being tossed under the bus.
 
Last edited:
Lead story on my local TV news tonight: Spike in new cases in Europe sparks concern!

Look at Sweden. Wait, what?! They're the ones who recklessly (some said suicidally) refused to lock down their country. Comeuppance still postponed. (Also, look who else is trending down, for the past 10 days.) New cases 1-week average, logarithmic scale.

91-DIVOC-countries-UnitedStates (2).jpg
 
Look at Sweden. Wait, what?! They're the ones who recklessly (some said suicidally) refused to lock down their country.

View attachment 1192870

COVID-19 deaths (so far) per million population from the countries highlighted in your graph:
Spain: 608
Sweden: 567
USA: 464
Germany: 110

Of the 27 EU countries, only Belgium, Spain, and Italy have more COVID-19 deaths per capita than Sweden.

COVID-19 deaths per million population in the countries that border Sweden: Norway (47), Finland (59), Denmark (106).
 
Thomas Paine, way back in 1787 wrote "These are the times that try mens souls.........". Look it it up, it will put a lot of perspective regarding personal freedoms versus tyranny. Just saying.
 
COVID-19 deaths (so far) per million population from the countries highlighted in your graph:
Spain: 608
Sweden: 567
USA: 464
Germany: 110

Of the 27 EU countries, only Belgium, Spain, and Italy have more COVID-19 deaths per capita than Sweden.

COVID-19 deaths per million population in the countries that border Sweden: Norway (47), Finland (59), Denmark (106).
That's one way to look at it. Here's another:

Of the 10 most populous countries in Western Europe, 9 of them "locked down": Germany, France, UK, Italy, Spain, Portugal, Belgium, Greece, Netherlands. Sweden of course did not. Yet 40% of those countries have more deaths per capita, and only 50% have fewer. That puts Sweden squarely in the middle third of the pack, having less than 2/3 of Belgium's deaths per capita. That's truly remarkable.

If you had predicted Sweden's position today in these ten countries upon learning they refused to lock down, it would have been like predicting Jamaica winning an Olympic silver medal in the Biathlon.
-
91-DIVOC-countries-normalized-Germany.jpg
-
 
Lockdowns - Two Sister States compared: Minnesota vs Wisconsin (excerpts from PowerLine Blog):

In the ongoing debate over whether shutdowns have been useful, a comparison of Minnesota and Wisconsin is a valuable data point. These two adjoining states are of comparable population, demographics, history and geography. A Wisconsinite is basically a Minnesotan without the smugness.

On the coronavirus, the states parted company on May 13, when the Wisconsin Supreme Court struck down that state’s “Safer at Home” order. Minnesota, meanwhile, continued under a lockdown, eventually in modified form, to the present day. To an observer, the difference is obvious: Wisconsin is open for business. Minnesotans cross the St. Croix to eat out and hang out in the restaurants and bars on the Wisconsin side of the river. Wisconsin isn’t quite South Dakota, but compared with Minnesota it is a bastion of freedom.

What happened when Wisconsin’s courts lifted that state’s shutdown order? My colleague John Phelan has the story. Liberals associated with Minnesota’s Walz administration predicted a dire body count. Ken Martin is the Chairman of Minnesota’s DFL party, and Steve Sack is the editorial cartoonist for the DFL’s flagship newspaper, the Star Tribune:


Not sure what's happening with our neighbors to the East, but I am quite certain we will see a huge increase in COVID related deaths thanks to their terrible courts. BTW - @thestevesack is the best political cartoonist in America hands down. Ken Martin
MN_vs_WI.jpg

Do cartoonists ever issue retractions or apologies? I suppose not. But Martin and Sack couldn’t have been more wrong. John Phelan picks up the story:

Figures from the Minnesota Department of Health and Wisconsin Department of Health Services show that, from May 14th to July 27th, Wisconsin suffered 472 Covid-19 deaths and Minnesota suffered 939, as seen on Figure 1. Again, given the two state’s broadly similar populations – 5.6 million in Minnesota and 5.8 million in Wisconsin – that means a much higher rate of Covid-19 deaths in our state as well as a much higher number. Indeed, between May 14th and July 27th, Wisconsin saw 81 Covid-19 deaths per million residents. In Minnesota, we saw 167 Covid-19 deaths per million residents – a rate 2.1 times higher.


91-DIVOC-states-normalized-Minnesota.jpg


John concludes with a good question: “To what does Mr. Martin attribute our state’s woeful performance?” Martin will never answer that question, of course. But a large part of the answer is that Minnesota’s governor, Tim Walz, is stunningly incompetent. Minnesota’s terrible COVID performance is due mostly to the fact that nearly 80% of its fatalities have been in nursing homes and assisted living facilities. Minnesota has discharged infected patients directly into such long term care facilities, a practice that Governor Walz, apparently unwilling to admit error no matter the human cost, continues to this day. (For an in-depth discussion of Minnesota’s COVID disaster, go here, or else read Scott’s multi-part series on Coronavirus In One State.)

Carnage in the nursing homes explains Minnesota’s terrible record compared with its neighbors, but it doesn’t answer the broader question: why, after 2 1/2 months, hasn’t Wisconsin seen the spike in deaths so confidently predicted by liberals when its shutdown ended?

One factor is that for young people, those under 25, COVID is less dangerous than the average seasonal flu. (Details at the link above.) So all those young people congregating in Wisconsin bars might be risking a cold, but they aren’t risking fatality. A state’s overall performance probably depends more than anything else on how well it protects its old people. Wisconsin has done a much better job of this than Minnesota, without restricting the rest of its population to their homes.

In any event, Wisconsin’s experience casts serious doubt on the claim that draconian shutdowns successfully prevent COVID fatalities.

https://www.powerlineblog.com/archives/2020/07/a-covid-border-battle.php

-
 
Last edited:
Sweden of course did not.

FYI Sweden had a partial lockdown / hybrid approach. But of course lockdown vs no lockdown isn't the be-all and end-all of the story. Pretty soon the US will have spent the vast majority of its new-COVID-case-count-weighted time without a formal lockdown. I fully expect its deaths/1 million pop to easily exceed Sweden's. Lots of factors involved.

Miami-Dade just delayed the reopening of schools a week and, more importantly, have confirmed that for at least the first month school will be distance learning. I wonder if parent suicides are included in the COVID death count...
 
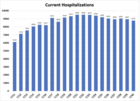
Finally found this charted. Good to see the number of COVID patients hospitalized in FL falling slightly (although discharge by death is obviously a factor).

Screen Shot 2020-07-30 at 2.18.33 PM.png
 
FYI Sweden had a partial lockdown / hybrid approach. But of course lockdown vs no lockdown isn't the be-all and end-all of the story. Pretty soon the US will have spent the vast majority of its new-COVID-case-count-weighted time without a formal lockdown. I fully expect its deaths/1 million pop to easily exceed Sweden's. Lots of factors involved.

Miami-Dade just delayed the reopening of schools a week and, more importantly, have confirmed that for at least the first month school will be distance learning. I wonder if parent suicides are included in the COVID death count...
Some polling in EU suggests Sweden had very low (lowest?) level of mask wearing at 14%. Yes there were some restrictions (mandatory or otherwise) in Sweden, but the least of any EU country from the data I've seen.

Suicides factor into "excess deaths", absolutely.

I found European excess mortality figures at Office for National Statistics here: https://www.ons.gov.uk/peoplepopula...europeancountriesandregions/januarytojune2020

The cumulative figures for excess deaths are expressed as relative cumulative age-standardised mortality rates (rcASMRs). A positive value indicates worse than average mortality, and a negative value indicates better than average mortality. If a country or area has an rcASMR of 10%, then their year-to-date mortality rate in 2020 compared with the five-year average is 10% higher than a year's worth of mortality over the previous five years.

Of the 10 most populous countries in W. Europe, the only countries I can find cumulative rcASMR through Week 22 (ranked highest to lowest) are:

UK ________ 7.40 (%)
Spain ______ 6.65
Belgium ____ 3.89
Sweden ____ 2.26
Netherlands _ 2.21
France ______0.16
Portugal ____ -0.91

Missing are Italy, Germany, and Greece. It's likely Italy will rank higher than Sweden, and both Germany and Greece lower. Once again that would put Sweden in the middle tertile.
-
 
Yes there were some restrictions (mandatory or otherwise) in Sweden, but the least of any EU country from the data I've seen.
-
Here's Sweden's official instructions:

https://www.krisinformation.se/en/h...-the-new-coronavirus/restriktioner-och-forbud

The most essential fact is that neither businesses nor whole industries were ever closed outright as elsewhere. Bars, clubs, restaurants, hair salons, schools - everything remained open. There are restrictions on the size of public gatherings to 50 people across the board, but exceptions include schools, public transport, private events and visits to shops. Visits to care facilities for the elderly were banned, and seniors were kept out of schools.

These are about as minimal as restrictions can get.
-
 
The 2 sets of numbers missing and what I consider the real data that needs to be reported and is ignored by the media is recoveries which would show true active cases.
Here in FT. Worth-Dallas, the news is reporting daily how many new cases are positive and throwing out the total cases to date, never reporting the number of recoveries or active.
Just keeping the fear factor in everyone's lives seems to be the new norm for the broadcast news reporters IMO.
Current numbers from one of their websites for 4 county metroplex in North Texas show 105,304 total cases since March but they do show 65,880 recovered for a total active cases of 39,424.
Not as scary as the 105,304 total, but they never mention this on live television.
 
If Sweden stops at about 5,000 or 6,000 deaths, we will know that they’ve reached herd immunity, and we didn’t need to do any kind of lockdown.

Dr. Michael Levitt, Nobel Laureate (chemistry and structural biology at Stanford University), May 04, 2020

https://www.stanforddaily.com/2020/...-19-curve-could-be-naturally-self-flattening/

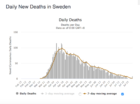
As of 31 July, Sweden has 5,743 deaths, with a daily growth rate ~0.2% for the past 22 days and dropping to near 0.1% over the last 7 days.
-
Deaths in Sweden doubled between 4 May and 31 July, or 88 days. Using "Rule of 70" that hindcasts a daily growth rate of 0.8%. At the rate of growth over the past 7 days the doubling time going forward would be 611 days.
-
 
Last edited:
If Sweden stops at about 5,000 or 6,000 deaths, we will know that they’ve reached herd immunity, and we didn’t need to do any kind of lockdown.

Dr. Michael Levitt, Nobel Laureate (chemistry and structural biology at Stanford University), May 04, 2020

https://www.stanforddaily.com/2020/...-19-curve-could-be-naturally-self-flattening/

As of 31 July, Sweden has 5,743 deaths, with a daily growth rate ~0.2% for the past 22 days and dropping to near 0.1% over the last 7 days.
-

And Sweden reported more COVID-19 deaths for the single day of 31 July than its neighbor Norway reported for the entire month of July combined, though both were in the very enviable single-digit range.

By mid-July fewer than 20% of Swedes showed serological evidence of past SARS-CoV-2 infection. Sweden is nowhere near herd immunity for a virus with an R0 of 2.5 or more.

If 5-6 thousand COVID-19 deaths in a population of ~10 million (Sweden) translated into herd immunity, as Levitt predicted, the U.S. would already be there (~160K deaths in a population of ~330M) with the same pattern of decline and current low daily death count that Sweden began in mid-April (and the same trajectory that the U.S. was on between mid-April and mid-June). But that's not what has happened.

The U.S. reversed course around Memorial Day, with the 2-week lag in reported cases and a 6-week lag in the daily deaths that resulted. Our current 7-day moving average of daily deaths reported has been >1000 for the past several days, growing exponentially at 0.7%/day. This is likely to continue for another few weeks, lagging the growth in Sun Belt cases by about a month.
Screen Shot 2020-08-01 at 2.32.44 PM.png Screen Shot 2020-08-01 at 2.31.29 PM.png

Three months ago Levitt predicted that the global daily death count for COVID-19 would peak between mid-July and 10 August. He isn't demonstrably wrong yet, but will be shortly. For Levitt's prediction to hold (i.e., for "the peak" to exceed April's highs) the 7-day moving average of reported daily global deaths would have to increase by 25% in the next 9 days, and I don't think that will happen, since it has grown less than 4% in the past 9 days, and the rate of growth is declining rather than increasing (see below).

Levitt's models use a Gompertz function to predict the number of cases and deaths. A Gompertz function increases monotonically but at an exponentially decreasing rate. In other words, it can't account for an increase in slope, like the one we actually observe after the first peak in mid-April in the U.S., or the one we are seeing globally now (below). The Gompertz function works fine for Sweden, Italy, and other countries that have not seen a resurgence (so far).
Screen Shot 2020-08-01 at 2.52.55 PM.png

If you read Levitt's (et al.) preprint from a month ago (Table 3), ironically deposited just at the time the recent U.S. surge started, his/their model predicted a plateau in U.S. COVID-19 cases at 2.1 million, even though the actual number of cases was already known to be 2.3 million. We're at more than twice that "plateau" today, with cases growing exponentially at 1.5%/day (doubling time 1.5 months).

My hat's off to Levitt et al. for sticking their necks out, but they missed this one by a country mile. Not alone in that camp, of course, even among people who are actual epidemiologists. :)
 
Deaths in Sweden doubled between 4 May and 31 July, or 88 days. Using "Rule of 70" that hindcasts a daily growth rate of 0.8%. At the rate of growth over the past 7 days the doubling time going forward would be 611 days.
-

According to the spreadsheet that I've been keeping, the 7-day moving average for U.S. doubling time* for COVID-19 deaths peaked on the 4th of July at 216 days. It's down to 116 days as of yesterday (Happy Thanksgiving!). I expect it to continue declining about 1-2 days per day until the backlog in the surge of cases that peaked a little over a week ago has finished being translated into deaths, roughly 3 weeks from now.

The 7DMA for doubling of deaths has been as short as 2.5 days during this pandemic, so things could be (and have been) worse.

*Doubling time = ln(2)/(ln(1+x)) where x is the decimal fraction of increase from the previous time period.
 
Status
Not open for further replies.

Upgrades & Donations

This Forum's expenses are primarily paid by member contributions. You can upgrade your Forum membership in seconds. Gold and Silver members get unlimited FREE classifieds for one year. Gold members can upload custom avatars.


Click Upgrade Membership Button ABOVE to get Gold or Silver Status.

You can also donate any amount, large or small, with the button below. Include your Forum Name in the PayPal Notes field.


To DONATE by CHECK, or make a recurring donation, CLICK HERE to learn how.

Forum statistics

Threads
165,436
Messages
2,195,825
Members
78,902
Latest member
Kapkadian
Back
Top