@Straightshooter1 , I was very impressed with your data. Not only with your discipline to collect and maintain your notes in such an organized fashion, but also with the results. The performance is exceptional.
I hope you don't mind me using a sample of your data to illustrate a point on the theme of prioritizing the target over the chrono. I plotted the SD versus your group size. What is shows is a R^2= 0.0592, and for those who don't speak statistics that is like saying no correlation at all.
Not to say don't use a chrono or pay attention. These data clearly show a meticulous disciplined loader at work, and a chrono is a form of Quality Control. It augments the target work, but doesn't trump it.
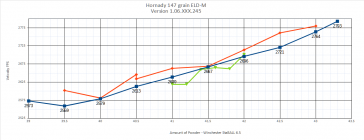
View attachment 1371057
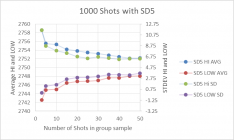
Here is another example of a great performing load, giving nearly a factor of three dispersion in SD values, while keeping under 0.5 MOA.
Well done Straighshooter1.


")

")