Here is another load for my 6mmCrdM

You are using an out of date browser. It may not display this or other websites correctly.
You should upgrade or use an alternative browser.
You should upgrade or use an alternative browser.
Load Development Using Chrono Velocity Ladder
- Thread starter CharlieNC
- Start date


This is getting into the weeds. First comment is that this spreadsheet is a commercial product and I have no way of knowing if the data is real or manufactured. Secondly, there are four sets of data for 76 grains that have similar means but markedly different SD’s for 5 shots samples.
As for your question I assume the point in question is Load 4. The first item to note is these are implied Labrador readings. That device has a stated accuracy of 0.1% of reading. This type of specification usually implies that there is a 95% chance that the reading is +/- 0.1% of its true value. In this case that’s +/- 2.7 fps or potentially 5.4 fps spread. This is a situation where the measuring instrument can actually effect the results. Normal practice is to assume that the instrument accuracy becomes significant when it is less than than 4x greater than the desired accuracy. This means tha when if the standard deviation is <0.4% the Labrador accuracy is affecting the reading. This is in addition to normal random sampling errors mentioned earlier.
So what do we know. Quantitatively we know that 5 76 gr rounds were tested very close to the same velocity. We can say that we know the test mean to probably +/- 2.7 fps assuming all the Labrador error is precision and not bias. Beyond that, we do not know a whole lot. We simple don’t have enough data. To prove this load is that good would require more testing.
A note on the spreadsheet. The 2xSD calculation is not a prediction of confidence interval for the population mean. The 2xSD calculation simply restates the distribution of the TEST data.
The data is mine, shot with my reload in my rifle. All MVs were measured using Labradar.This is getting into the weeds. First comment is that this spreadsheet is a commercial product and I have no way of knowing if the data is real or manufactured. Secondly, there are four sets of data for 76 grains that have similar means but markedly different SD’s for 5 shots samples.
As for your question I assume the point in question is Load 4. The first item to note is these are implied Labrador readings. That device has a stated accuracy of 0.1% of reading. This type of specification usually implies that there is a 95% chance that the reading is +/- 0.1% of its true value. In this case that’s +/- 2.7 fps or potentially 5.4 fps spread. This is a situation where the measuring instrument can actually effect the results. Normal practice is to assume that the instrument accuracy becomes significant when it is less than than 4x greater than the desired accuracy. This means tha when if the standard deviation is <0.4% the Labrador accuracy is affecting the reading. This is in addition to normal random sampling errors mentioned earlier.
So what do we know. Quantitatively we know that 5 76 gr rounds were tested very close to the same velocity. We can say that we know the test mean to probably +/- 2.7 fps assuming all the Labrador error is precision and not bias. Beyond that, we do not know a whole lot. We simple don’t have enough data. To prove this load is that good would require more testing.
A note on the spreadsheet. The 2xSD calculation is not a prediction of confidence interval for the population mean. The 2xSD calculation simply restates the distribution of the TEST data.
There is a theory I introduced in 2018, and I called it Optimum FPS.
If you have some free time, you can read it here:
OFPS Theory.docx
I expected to catch a full ration when I posted the statistical variation simulation and I was not disappointed. No one that I have seen has even posted a plausible theory as why it would exist. Such an explanation is necessary to explain how adding energy in a rifle system can result in a reduction in the increase in velocity or even a reduction as shown on some of the plots.
Now the Father of the One Shot Chronograph Ladder is Scott Satterlee and I have followed his method over time because I quite frankly didn’t buy it. He has changed his load development theory over time. It takes about an hour to go through the two videos but I would encourage people interested in this subject to spend some time with them. The first is the third of a three part series.
I think you are hinting at an important point. It's rare when we can shoot enough and get consistent enough results to satisfy the statistics gods. In high accuracy disciplines like BR, both short and long range; we are constantly refining our load. We use inductive reasoning, trial and error, and a little luck--which almost never works with a proper statistical analysis.
All this means two main things. We know WHAT works much more than we know WHY it works; and shooting is as much art as it is science.
Be nice to see Applied Ballistics, since they have the funds, to shoot out an entire barrel and track the SDs/ES over the life of the barrel in a short period of time.This is getting into the weeds. First comment is that this spreadsheet is a commercial product and I have no way of knowing if the data is real or manufactured. Secondly, there are four sets of data for 76 grains that have similar means but markedly different SD’s for 5 shots samples.
As for your question I assume the point in question is Load 4. The first item to note is these are implied Labrador readings. That device has a stated accuracy of 0.1% of reading. This type of specification usually implies that there is a 95% chance that the reading is +/- 0.1% of its true value. In this case that’s +/- 2.7 fps or potentially 5.4 fps spread. This is a situation where the measuring instrument can actually effect the results. Normal practice is to assume that the instrument accuracy becomes significant when it is less than than 4x greater than the desired accuracy. This means tha when if the standard deviation is <0.4% the Labrador accuracy is affecting the reading. This is in addition to normal random sampling errors mentioned earlier.
So what do we know. Quantitatively we know that 5 76 gr rounds were tested very close to the same velocity. We can say that we know the test mean to probably +/- 2.7 fps assuming all the Labrador error is precision and not bias. Beyond that, we do not know a whole lot. We simple don’t have enough data. To prove this load is that good would require more testing.
A note on the spreadsheet. The 2xSD calculation is not a prediction of confidence interval for the population mean. The 2xSD calculation simply restates the distribution of the TEST data.
Taking, say, 1800 shots with the same loads and rifle would be a good sample size.
For example, 6 loads would get 300 shots each (minus foulers).
They could check for flat spots over time and all that stuff we have to verify using small sample sizes
Be nice to see Applied Ballistics, since they have the funds, to shoot out an entire barrel and track the SDs/ES over the life of the barrel in a short period of time.
Taking, say, 1800 shots with the same loads and rifle would be a good sample size.
For example, 6 loads would get 300 shots each (minus foulers).
They could check for flat spots over time and all that stuff we have to verify using small sample sizes
The issue with that is the barrel doesn't stay the same over 1800 rounds. Or even 300 rounds. Loads need to be constantly adjusted to maintain best accuracy, as in BR level accuracy. The barrel won't likely keep BR accuracy to 1800 rounds either.
And that is our conundrum. We need to shoot a lot and to a high level of precision for a statistically meaningful analysis, but maintaining a high level of precision requires constant adjustments to the load. So the best powder charge and seating depth at 300 rounds won't be exactly the same at 1200 rounds.
As such, I don't think answers are in statistical analysis.
Last edited:
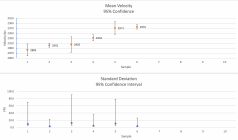
Here is my analysis of your 6CM data. It based on 95% confidence interval and give a picture of what happens with 3 shot tests. You have 3 points that have fairly tight confidence and 3 that are not tight at all. This is especially true of the standard deviation.Here is another load for my 6mmCrdM
There are methods that can be used to compare both the means and the standard deviations between two tests but this comparison gives you an idea of what the results would be. If you look at the standard deviation of Samples 2 and 3 because the CI overlaps on the tested SD of both, we conclude that we do not have enough data to say that the standard deviations are different. If you look at Samples 4 and 5 where 1 CI captures the other mean we have have the same issue.
Attachments
Thanks a lot for taking time to do the analysis.Here is my analysis of your 6CM data. It based on 95% confidence interval and give a picture of what happens with 3 shot tests. You have 3 points that have fairly tight confidence and 3 that are not tight at all. This is especially true of the standard deviation.
There are methods that can be used to compare both the means and the standard deviations between two tests but this comparison gives you an idea of what the results would be. If you look at the standard deviation of Samples 2 and 3 because the CI overlaps on the tested SD of both, we conclude that we do not have enough data to say that the standard deviations are different. If you look at Samples 4 and 5 where 1 CI captures the other mean we have have the same issue.
Since we are discussing the meaningful of samples of data, SD, ES, I will share an online tool to compute group size with a level confidence meter. I did once 14 shots groups analysis and all my groups size came back as meaningless data
 guns.ptosis.ch
TARAN -- User Manual | guns@ptosis
Last edited:
Here is a 3 part article on Statistical analysis for our shooting world
 precisionrifleblog.com
How To Predict The Future – Statistics For Shooters Part 1
I actually believe the average shooter might get more value from this Statistics for Shooters serie...

RifleHere is a screenshot for a 14-shot group, data is in radius, when the metrics has R, such as R50 and Group size when the metrics has D such as D5x and D10x
Rifle is a factory SIG M400 with 16" barrel.
Ammo is 75gr DRI, (no more in production).
View attachment 1359037

CharlieNC
Gold $$ Contributor
I think you are hinting at an important point. It's rare when we can shoot enough and get consistent enough results to satisfy the statistics gods. In high accuracy disciplines like BR, both short and long range; we are constantly refining our load. We use inductive reasoning, trial and error, and a little luck--which almost never works with a proper statistical analysis.
All this means two main things. We know WHAT works much more than we know WHY it works; and shooting is as much art as it is science.
You make an excellent point regarding how many regard there is a disconnect in that a "proper" statistical answer requires too many shots vs interpreting results based on history and experience. Unfortunately too much is made about how comparing A to B requires many shots so a valid conclusion cannot be made. The fact is there is much useful statistical information available from everyday shooting which leads one to "know" when an improvement or deterioration has occured, but that info is not protrayed during routine discussion. This is important enough that I will probably belabor the point......
To make a statistical decision, the simple criteria is based on having a large enough signal to clearly distinguish it from the noise. So trying to decide if very small differences are significant can require a lot more data to reduce the noise. But consider a few examples.
Assume you have a new barrel and have shot 20 3-shot groups over the last couple of weeks, and the groups range from 3/4" to 1 1/4". You decide its time to try a new primer vs the standard. Two 3-shot groups from the old primer shoot 1", and the new primer shoots two 1/4" groups; you are happy at the progress and report it on AS only to be bashed to learn you didn't shoot enough to have statistical significance between 1" vs 1/4"; thats because the "noise" you reported is only for the last trial shots and that is all that is available for others to interpret. No one knows about the performance of the previous 20 groups which contains much more useful info about the noise, and on that basis the new primer results are clearly statistically significant. The massive amount of historical info we have is valuable and useful from a statistical standpoint, and unfortunately we tend not to premise a discussion on this.
Continuing with this example lets assume we do a ladder test using 10 charge weights and the resulting 3-shot group sizes range from 1/2" to 1 1/2" so overall just a little more variable than the historical 20 groups. Clearly 3-shot groups are not enough to learn anything, because you read it takes xxx shots to have any significance! But these types of discussions are typically in the context of "I want to know what is the expected group size of this load" which you do not need to know when studying cause and effect, especially across a continuous scale such as charge weight. If you a make a graph of group size vs charge weight and it exhibits a very clear trend, that correlation can be tested for statistical significance; the question is regarding distiguishing the cause and effect signal vs the background noise, not trying to state the long term group size. Two different questions.
In the context of my original post about single shot chrono ladder testing, we have historical or available knowledge about how much velocity change is expected by a small charge weight change plus typical velocity SD to assess if a single shot is enough to distinguish the signal vs noise.....
Jager
Gold $$ Contributor
Just to add to Charlie's post...
The majority of load development doesn't need enough record shots to reach statistical significance. All it needs is enough shots to be able to quickly throw out all those loads that don't work. Which is most of them.
If I'm running a seating depth test, I'll frequently shoot 2-shot groups. That's clearly not remotely enough to be statistically significant. Doesn't matter. Because the whole exercise is only about two things... identifying any patterns that emerge and floating up which loads I don't need to waste any more time on.
Ultimately, the small subset of loads that remain, those that warrant further investigation, will get more repeats. They'll eventually get to a point of statistical significance. Just not at the beginning.
Ned Ludd
Silver $$ Contributor
I think it's important not to lose track of the specific goal of load development, which is to find a load that shoots both small and consistently. I think it is fair to say that people have used a variety of different methods to successfully achieve that goal over the years. One thing I think is that often overlooked during statistical analysis of group size, velocity ES/SD, etc., is that pretty much everything we do is aimed at minimizing our results. In other words there is inherent bias at every step of the process, because we are trying to minimize group size and/or velocity ES/SD with every single action we take in the reloading process. In other words, the outputs of group size and velocity ES/SD are not exactly "normal" distributions to begin with.
So what does that inherent bias mean with regard to the patterns we observe? I'm sure most everyone has encountered arguments at shooting forums regarding the minimum number of shots necessary for a group to have statistical significance, either in terms of size or the associated velocity data. My take on that is a bit different from the classic statistical interpretation, and I'll use velocity as example to explain why I think about it in this way.
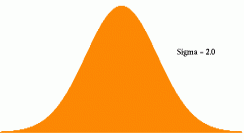
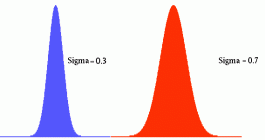
If one were to fire a large number of shots and prepare a distribution graph of the data, it would commonly be done as velocity on the X-axis (i.e. score), and the number of shots at a given velocity, or within a given velocity range on the y-axis (i.e. frequency). This type of plot is commonly referred to as a "Gaussian" distribution, or even more commonly as a "bell curve". Picture bell curves with the same axis labels/intervals: one is fairly wide and gently rounded at the mean as shown in the attached images (below); the others are much narrower and steeper. It may seem as though I'm taking advantage of semantics here, because assuming they are normal distributions, one could make both bell curves appear the same simply by adjusting the interval on one axis or another. However, this is not semantics for the following reason: the X-axis for both graphs is velocity as measured in fps, which implies certain things in terms of limiting sources of error. The best commercially available chronographs are limited in term of accuracy/precision to perhaps 2-3 fps under absolutely ideal conditions. Thus, the fact that many of the things a reloader does at the bench are aimed at minimizing velocity variance may effectively cause the distribution to become less wide, perhaps even to the point at which the width at a given SD is almost meaningless because of the limited accuracy/precision of the chronographs we typically use. A very tall narrow distribution means that you don't need as many shots to determine whether your velocity falls within a reasonable SD from the mean, because of the units (fps) used for the x-axis are fixed in relation to the accuracy limitation of the typical chronograph.
My point is simply this - stats can be your friend, so record the data and use it where appropriate. But don't start thinking that the stats themselves are the end-all, be-all of load development. They aren't. Remember that most reloaders are trying to do everything they can to make their groups as small as possible and/or minimize velocity ES/SD. That bias can have an impact on how we interpret test results in terms of how many shots are necessary, and what we can really conclude when we subsequently compare group size/velocity data. Along that line of thinking, some people that have posted herein obviously have an issue with ladder tests due to a sample size of n=1 for each shot. That's fine, to each their own. But that doesn't mean shooters have never successfully used a ladder test to develop a winning load...because they have. Just as other methods have been successfully employed. Find the method that works best in your hands, understand what the method is actually doing, and have at it. Getting way down deep in the weeds is not always a necessary or desirable part of load development.
So what does that inherent bias mean with regard to the patterns we observe? I'm sure most everyone has encountered arguments at shooting forums regarding the minimum number of shots necessary for a group to have statistical significance, either in terms of size or the associated velocity data. My take on that is a bit different from the classic statistical interpretation, and I'll use velocity as example to explain why I think about it in this way.
If one were to fire a large number of shots and prepare a distribution graph of the data, it would commonly be done as velocity on the X-axis (i.e. score), and the number of shots at a given velocity, or within a given velocity range on the y-axis (i.e. frequency). This type of plot is commonly referred to as a "Gaussian" distribution, or even more commonly as a "bell curve". Picture bell curves with the same axis labels/intervals: one is fairly wide and gently rounded at the mean as shown in the attached images (below); the others are much narrower and steeper. It may seem as though I'm taking advantage of semantics here, because assuming they are normal distributions, one could make both bell curves appear the same simply by adjusting the interval on one axis or another. However, this is not semantics for the following reason: the X-axis for both graphs is velocity as measured in fps, which implies certain things in terms of limiting sources of error. The best commercially available chronographs are limited in term of accuracy/precision to perhaps 2-3 fps under absolutely ideal conditions. Thus, the fact that many of the things a reloader does at the bench are aimed at minimizing velocity variance may effectively cause the distribution to become less wide, perhaps even to the point at which the width at a given SD is almost meaningless because of the limited accuracy/precision of the chronographs we typically use. A very tall narrow distribution means that you don't need as many shots to determine whether your velocity falls within a reasonable SD from the mean, because of the units (fps) used for the x-axis are fixed in relation to the accuracy limitation of the typical chronograph.
My point is simply this - stats can be your friend, so record the data and use it where appropriate. But don't start thinking that the stats themselves are the end-all, be-all of load development. They aren't. Remember that most reloaders are trying to do everything they can to make their groups as small as possible and/or minimize velocity ES/SD. That bias can have an impact on how we interpret test results in terms of how many shots are necessary, and what we can really conclude when we subsequently compare group size/velocity data. Along that line of thinking, some people that have posted herein obviously have an issue with ladder tests due to a sample size of n=1 for each shot. That's fine, to each their own. But that doesn't mean shooters have never successfully used a ladder test to develop a winning load...because they have. Just as other methods have been successfully employed. Find the method that works best in your hands, understand what the method is actually doing, and have at it. Getting way down deep in the weeds is not always a necessary or desirable part of load development.
Attachments
Thanks for linking this in. It is one of the best explanations of the statistical analysis process I have read. Unfortunately it does get somewhat confusing as I recall because of the terminology used. But that is one of the issues with statistics in general.Here is a 3 part article on Statistical analysis for our shooting world
How To Predict The Future – Statistics For Shooters Part 1
I actually believe the average shooter might get more value from this Statistics for Shooters serie...
These calculations assume a normal distribution, yes?
Do we know how shots are actually distributed? Are they distributed differently for a rifle that's' "in tune"?
Sorry I missed this. Normal distribution is the mathematical concept on which the formulas are based. Normal distribution applies to the population (large number of samples). By its very nature the sample is typically not normally distributed. Also, just to clarify, the mean of velocity for the population is considered to be normally distributed. Standard deviation is not normally distributed. That is why the confidence interval of SD is so skewed.
By the way, I'll look into the Taran project.
jelenko
Gold $$ Contributor
Right. I'm familiar with normal distributions and a little with the statistics associated with them.Thanks for linking this in. It is one of the best explanations of the statistical analysis process I have read. Unfortunately it does get somewhat confusing as I recall because of the terminology used. But that is one of the issues with statistics in general.
Sorry I missed this. Normal distribution is the mathematical concept on which the formulas are based. Normal distribution applies to the population (large number of samples). By its very nature the sample is typically not normally distributed. Also, just to clarify, the mean of velocity for the population is considered to be normally distributed. Standard deviation is not normally distributed. That is why the confidence interval of SD is so skewed.
By the way, I'll look into the Taran project.
I was wondering if a large number of shots from the same barrel would be normally distributed. If they wouldn't, then the math/statistics we use wouldn't apply.
This led me to wonder if the distribution of shots from a barrel that's in tune would differ from a barrel that's not in tune.
What caused me to do all this wondering was, well, wondering how the experiences of expert, experienced benchrest shooter could be 'explained' given that many of them do pretty well without shooting groups with statistically significant number of shots.
Group size is all that matters. You can get lost interpreting numbers.Proponents of a single shot chrono ladder seem to have fallen out of favor due to the insufficient statistics, but wondering if anyone has tried this using a "valid" number of shots to find anything informative? Im trying to stay open minded.
I seen a lot of Radars on benches at the 600yd Nationals past weekend…
Yet they rendered useless by them using it… which took up time to set it up & tear it down.
5 people actually loaded at the range -during the match to stay on top of their game .
Mr. Sauter was one of them that loaded at the range.
I had mine out 2 days prior to the event-testing &tuning.. on match day, it (radar) didn’t block my view of the flags that was out..cause I didn’t set it up or load at the range.
I carried 3-4 different loads for each rifle to the bench- depending on temp
Similar threads
- Replies
- 32
- Views
- 2,931
Upgrades & Donations
This Forum's expenses are primarily paid by member contributions. You can upgrade your Forum membership in seconds. Gold and Silver members get unlimited FREE classifieds for one year. Gold members can upload custom avatars.

Click Upgrade Membership Button ABOVE to get Gold or Silver Status.
You can also donate any amount, large or small, with the button below. Include your Forum Name in the PayPal Notes field.
To DONATE by CHECK, or make a recurring donation, CLICK HERE to learn how.
Click Upgrade Membership Button ABOVE to get Gold or Silver Status.
You can also donate any amount, large or small, with the button below. Include your Forum Name in the PayPal Notes field.
To DONATE by CHECK, or make a recurring donation, CLICK HERE to learn how.