• This Forum is for adults 18 years of age or over. By continuing to use this Forum you are confirming that you are 18 or older. No content shall be viewed by any person under 18 in California.

Statistics

Alex, after 6 pages it may be too late to add anything constructive to your post but I will offer my view on you post. Statistical analysis is another tool in our toolbox. It is a valuable tool for those who understand the tool and how to use it. Few people have that capability. Many of the biggest critics of this tool do not understand the subject or how to use the tool. Many people comment as if they understand the tool when it is obvious they do not. Best wishes.
I guess thats my point. Im a critic and dont have any formal knowledge on the subject but I can tune a gun with small sample sizes. Like many others can.
We dont see it as much here, but when I was still on facebook I posted a ton of pictures of targets. It was an easy format to do that on. I constantly heard how those targets where not valid and had to be repeated many times. Stuff like back to back zeros or ones at 1k.
 
I constantly heard how those targets where not valid and had to be repeated many times. Stuff like back to back zeros or ones at 1k.
I call it triage for self preservation, where you have to sort out those you can save from those who can't be helped...

Save the ones you can, quietly and politely cut the rest loose...

Customers and suppliers are one thing, but we have all seen the kind of trolls who just gyrate you to waste your bidding budget and steal your time.

You can only help with so much from your platform, so don't feel bad about letting them be. They either listen and take the help, then do their own homework and learn something, or they are not your problem.

Let your work and targets do your talking for you. You owe those internet trolls nothing and your work and the successes of your clients speak loud and clear.

If you ever needed help with statistics or engineering, you know enough folks who would bend over backwards to help you.
 
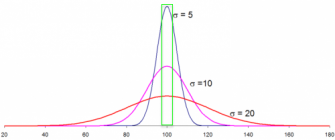
I don't think there is anything wrong with using statistics in what we do, but it must be used appropriately and correctly. So it must first be acknowledged that everything we do in shooting is heavily biased toward shooting small. For that reason, the normal distribution we're really dealing with would be analogous to the tall thin [blue] curve shown in the image below:

threenormaldistributions2.png

Note that the standard deviation of this curve corresponds to sigma = 5. In other words, deviation about the mean is far less on average than for the other two curves with larger standard deviations. Another way of stating this would be to say that the values under the blue curve are all much closer on average to the mean value (100). Also note that all three curves have the exact same total area, and that they all use the exact same units on the x-axis.

What these curves mean can be explained as follows. I added the green box around the mean value (i.e. 100) to represent some "acceptable" value a shooter might want or be looking for. For example, it might represent group size, it might represent velocity, it might represent case volume, or something else entirely. What we are looking for as illustrated by the green box is some set of values that are acceptably close to the mean, meaning they have minimal deviation from the mean.

The key here is that the area of the green box only represents about 10% of the total area under the [red] sigma = 20 curve, about 20% of the area under the [pink] sigma = 10 curve, and about 40% of the area under the [blue] sigma = 5 curve. In other words, when you have a distribution that is biased such that the values in it do not deviate far from the mean (i.e. tall and narrow), by definition any interval selected on the x-axis will represent a much larger area under the curve than it would for a distribution that has significant variance from the mean (i.e. short and wide). Even though the width of the green box equals the same number of units for all three curves, it occupies 40% of the area under the tall narrow [blue] distribution curve, which is double the area of the green box under the pink curve and four times the area of the green box under the red curve.

It should not be surprising that a much greater percentage of values in the tall and narrow distribution would fall into the [green] "acceptable" box. Likewise, it shouldn't be difficult to envision why a smaller number of values might be sufficient to generate a high degree of confidence. In contrast, a distribution where variance about the mean is large, thus generating a curve that is wide and short, would require a greater number of values tested to obtain a similar number of "acceptable" values (i.e. those in the green box).

Everything we do is aimed at shooting small. As such we have biased the resulting distribution(s) to have a much narrower standard deviation than might otherwise be expected from a completely random process. The result of that follows statistics perfectly and is clearly demonstrated by the [blue] tall and narrow distribution curve. There's nothing wrong with usaing statistics in shooting, but it has to be applied correctly and the assumptions under which it is used must be valid.

Along this line of reasoning, I typically shoot 3-shot groups for seating depth. I can't "accidentally" stack 3 up in the same hole with a sub-optimal seating depth. Nor is the wind going to fortuitously blow one of the shots back into the group. Those things just don't happen, ever. Further, if I were to use 10-shot groups instead, I would simply be measuring "me", not the load. I don't personally care how many shots anyone uses for group size, or for anything else, because I really don't have any stake in someone else's shooting, only my own. But it does get old when people spout "statistics values" about how many shots it takes to know this or that, which are usually completely off for the reason that everything we do is so heavily biased toward shooting small. So I get Alex's frustration, and I believe the reasons I outlined above are why what we do may sometimes seem not to necessarily obey statistics, even though it really does.
 
Last edited:
I don't think there is anything wrong with using statistics in what we do, but it must be used appropriately and correctly. So it must first be acknowledged that everything we do in shooting is heavily biased toward shooting small. For that reason, the normal distribution we're really dealing with would be analogous to the tall thin [blue] curve shown in the image below:

View attachment 1442485

Note that the standard deviation of this curve corresponds to sigma = 5. In other words, deviation about the mean is far less on average than for the other two curves with larger standard deviations. Another way of stating this would be to say that the values under the blue curve are all much closer on average to the mean value (100). Also note that all three curves have the exact same total area, and that they all use the exact same units on the x-axis.

What these curves mean can be explained as follows. I added the green box around the mean value (i.e. 100) to represent some "acceptable" value a shooter might want or be looking for. For example, it might represent group size, it might represent velocity, it might represent case volume, or something else entirely. What we are looking for as illustrated by the green box is some set of values that are acceptably close to the mean, meaning they have minimal deviation from the mean.

The key here is that the area of the green box only represents about 10% of the total area under the [red] sigma = 20 curve, about 20% of the area under the [pink] sigma = 10 curve, and about 40% of the area under the [blue] sigma = 5 curve. In other words, when you have a distribution that is biased such that the values in it do not deviate far from the mean (i.e. tall and narrow), by definition any interval selected on the x-axis will represent a much larger area under the curve than it would for a distribution that has significant variance from the mean (i.e. short and wide). Even though the width of the green box equals the same number of units for all three curves, it occupies 40% of the area under the tall narrow [blue] distribution curve, which is double the area of the green box under the pink curve and four times the area of the green box under the red curve.

It should not be surprising that a much greater percentage of values in the tall and narrow distribution would fall into the [green] "acceptable" box. Likewise, it shouldn't be difficult to envision why a smaller number of values might be sufficient to generate a high degree of confidence. In contrast, a distribution where variance about the mean is large, thus generating a curve that is wide and short, would require a greater number of values tested to obtain a similar number of "acceptable" values (i.e. those in the green box).

Everything we do is aimed at shooting small. As such we have biased the resulting distribution(s) to have a much narrower standard deviation than might otherwise be expected from a completely random process. The result of that follows statistics perfectly and is clearly demonstrated by the [blue] tall and narrow distribution curve. There's nothing wrong with usaing statistics in shooting, but it has to be applied correctly and the assumptions under which it is used must be valid.

Along this line of reasoning, I typically shoot 3-shot groups for seating depth. I can't "accidentally" stack 3 up in the same hole with a sub-optimal seating depth. Nor is the wind going to fortuitously blow one of the shots back into the group. Those things just don't happen, ever. Further, if I were to use 10-shot groups instead, I would simply be measuring "me", not the load. I don't personally care how many shots anyone uses for group size, or for anything else, because I really don't have any stake in someone else's shooting, only my own. But it does get old when people spout "statistics values" about how many shots it takes to know this or that, which are usually completely off for the reason that everything we do is so heavily biased toward shooting small. So I get Alex's frustration, and I believe the reasons I outlined above are why what we do may sometimes seem not to necessarily obey statistics, even though it really does.
Cool!
 
I'm in the test known or very good component combinations and look for good candidate. I think the whole process can get too academic if you're not careful. Just the process of shooting changes the condition of the barrel, then there is user error, not only in shooting groups but in the preparation of the ammunition. Then there are the conditions.

I take that best candidate and go and shoot it, I soon see if it's giving me the precision I need. If it's acceptable, I concentrate on the much bigger factors, my input and the wind.
 
Alex, you need to post a pic of you sitting there with a big bag of popcorn and a cold one, with the internet shovel to stir it up again occasionally while watching this. You da man.
BTW, I agree with you, no need to burn barrels out testing.
 
I may be different than many of you real target shooters. I don't see how you can take something as fun, exhilarating, exciting, rewarding, and thrilling as shooting is and turn it into math homework.

To be honest, nobody has to do any math homework or have any formal knowledge of statistics. That's where the discussion leads because it's two sides discussing the issue on paper but if we all went out to the range and shot together trying some of these different things we could discuss it without the math.
 
  • Like
Reactions: ebb

Upgrades & Donations

This Forum's expenses are primarily paid by member contributions. You can upgrade your Forum membership in seconds. Gold and Silver members get unlimited FREE classifieds for one year. Gold members can upload custom avatars.


Click Upgrade Membership Button ABOVE to get Gold or Silver Status.

You can also donate any amount, large or small, with the button below. Include your Forum Name in the PayPal Notes field.


To DONATE by CHECK, or make a recurring donation, CLICK HERE to learn how.

Forum statistics

Threads
166,278
Messages
2,214,934
Members
79,496
Latest member
Bie
Back
Top