• This Forum is for adults 18 years of age or over. By continuing to use this Forum you are confirming that you are 18 or older. No content shall be viewed by any person under 18 in California.

Scratching Head

Hello All,

Starting playing with a new load for my 300 RUM
Prior I was using Retumbo with a 210 VLD and had real good results.
I got a hold of some N570, ran some number through QL and started with file attached
300 RUM
N570- started 96.4
Berger 210 VLD Hunt
GM215
Hart- 27.625
COAL-- 3.728
BTO-- -3.039 ".020 SEATING DEPTH"

Redding Press & Dies
A&D FX120 / AT V3
Never had any issues


What's interesting is the range of velo with the powder charge?

I'm thinking of playing around seating depth with 96.6

Tell me what you think

Thanks!!
 

Attachments

Last edited:
I’m not sure what you are interested in. But I'll take a run at it. If you are in reference to the speed increase per charge I can tell you that you have insufficient data to make any comparison between charges.

First off the spreadsheet you are using for mean and standard yields the correct mean. That mean is only for the three charge points you tested. The Standard deviation is for only the three rounds tested (sampled) and means that 95% of your sampled data lie within +/-2 standard deviations. With 3 charges this will include the two ES values since they comprise 67% of the data.

What you are interested in is what this limited test data tells you about any additional loads (population) and whether in this case there is a flat spot. To do this you have to use the data taken to predict what will happen with more rounds. I am attaching an analysis of your data using it to create a 95% confidence interval for mean and standard deviation. This interval for each charge weight essential states that there is a 95% chance that the true mean and standard deviation lie within that range. As you can see there is a wide range of both mean and standard deviation, mostly due to the three rounds per charge.

As for flat spots they are a function of the test. If you look your flat spots are in the charge weights with the highest uncertainty.

Edited attachment as one sample set had wrong count of points.
 

Attachments

  • Screen Shot 2022-05-16 at 8.29.52 PM.png
    Screen Shot 2022-05-16 at 8.29.52 PM.png
    80.8 KB · Views: 33
Last edited:
Thank You very much
Hahaha, I think I might have to read this a few times to get grasp but really do appreciate you providing the file.

What I thought was somewhat strange was in some areas with a powder charge increase there was a velocity drop, that was new to me.
 
Last edited:
Tell me what you think
If you had prepped and primed cases with you at the range, you would have shot more rounds at 96.8 and 97.8 to see if they matched the previous three shots, or if they made the stats grow.

Suppose you have more of those prepped and primed rounds after the above tests, and you picked one of those two charges and made up a whole bunch at just about touch/jam. Then you would have the ability to test a few more at the length you did before and again see if the stats again held stable and you shot those at distance to see their vertical spread.

If they did print a decent vertical, you would then sweep the seating depths with a single round at each depth out at maximum range and examined the shot fall for tightest vertical nodes, and then made more of those that you suspected were the likely best depth nodes to pour more shots into those depths and pick the best group.

You then make as many as it takes to give you confidence you made the right speed and depth selections without using any more shots on charges or depths you will not use.

If you go to the range with your loading gear and prepped brass, you can leave with your charge and depth answers in the same day. I would put more emphasis on the group (vertical and group size) at range, than I would on very skinny speed stats. YMMV
 
Have you been over on cortina’s forum? Lots of info on this method over there. I don’t see many doing it this way here. I guess there’s multiple ways to get to the same destination. In my opinion you’re on the right track.
 
If you had prepped and primed cases with you at the range, you would have shot more rounds at 96.8 and 97.8 to see if they matched the previous three shots, or if they made the stats grow.

Suppose you have more of those prepped and primed rounds after the above tests, and you picked one of those two charges and made up a whole bunch at just about touch/jam. Then you would have the ability to test a few more at the length you did before and again see if the stats again held stable and you shot those at distance to see their vertical spread.

If they did print a decent vertical, you would then sweep the seating depths with a single round at each depth out at maximum range and examined the shot fall for tightest vertical nodes, and then made more of those that you suspected were the likely best depth nodes to pour more shots into those depths and pick the best group.

You then make as many as it takes to give you confidence you made the right speed and depth selections without using any more shots on charges or depths you will not use.

If you go to the range with your loading gear and prepped brass, you can leave with your charge and depth answers in the same day. I would put more emphasis on the group (vertical and group size) at range, than I would on very skinny speed stats. YMMV
I am not very knowledgeable in statistics but I have a few opinions. I believe there is a formula to calculate the population size to get good data. No-one uses it. I am sure the proper population size would be a large number. I don’t believe in flat spots. They only exist because of limited data and ignoring ES accuracy. The only reason you get a 95% confidence level is because there isn’t much difference between the lightest and heaviest charge. Group size is what I look for small and round. My GH rifles shoot under 0.400” with cheap bullets. Thanks to Kreiger barrels.
1653436232607.png
Scroll down to see the entire chart.


ADDED LATER:

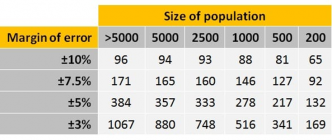
Most statisticians agree that the minimum sample size to get any kind of meaningful result is 100. If your population is less than 100 then you really need to survey all of them.’

If you want to be a bit more scientific then use this table

While the previous rules of thumb are perfectly acceptable for most basic surveys, sometimes you need to sound more “scientific” in order to be taken seriously. In that case you can use the following table. Simply choose the column that most closely matches your population size. Then choose the row that matches the level of error you’re willing to accept in the results.


Based on the chart if there was 200 shots in the population you need 65 shots to get 10% error and 169 shots to get 3% error. Probably an unexplained variable is the type of data your looking at. If you have 5 loads is each a separate population. Don't think the below chart may apply to many separate groups composing a bigger population. Groups composing a larger population would be a far more complicated analysis? I think most of the statistics we encounter are for one large like group, like if there are 1000 like parts being machined how many do you expect to be in spec. based on the history of the part and what is the range of error. 1653436232607.png
 
Last edited:
Doesn't the math behind that table NOT assume a 'normal' distribution?

I think if you assume a normal distribution the required sample size goes down - yes?
 
Doesn't the math behind that table NOT assume a 'normal' distribution?

I think if you assume a normal distribution the required sample size goes down - yes?
Don't know. You are probably correct. I think most of the statistics we hear about concern one group of similar data. Multiple groups are probably difficult to analyze. Not sure what you would be analyzing them for. I don’t understand how you find an accurate load by plotting FPS VS powder charge. I will always find a good load by looking for small groups on a target. Tony Boyer doesn’t do all this graphing. He shoots groups and evaluates them. Buy his book.
 
charts and graphs are for peole who do not understand the basics and cannot work up a load from a simple ladder and then eval 3 shot and 5 shot groups...then fine tune.
most the time it just aint that hard
 
charts and graphs are for peole who do not understand the basics and cannot work up a load from a simple ladder and then eval 3 shot and 5 shot groups...then fine tune.
most the time it just aint that hard
I agree. I don't think you can relate charts and statistics to what will shoot well in your rifle.
 

Upgrades & Donations

This Forum's expenses are primarily paid by member contributions. You can upgrade your Forum membership in seconds. Gold and Silver members get unlimited FREE classifieds for one year. Gold members can upload custom avatars.


Click Upgrade Membership Button ABOVE to get Gold or Silver Status.

You can also donate any amount, large or small, with the button below. Include your Forum Name in the PayPal Notes field.


To DONATE by CHECK, or make a recurring donation, CLICK HERE to learn how.

Forum statistics

Threads
166,265
Messages
2,215,174
Members
79,506
Latest member
Hunt99elk
Back
Top