Have been a bit disappointed not to see any data to address this issue and so set out to find an answer.
The results you see below is the sum total of two separate experiments conducted on two separate days each experiment using 10 pieces of brass. The brass used here is Lake City LC09 twice fired (by me) 223 brass that has been cleaned with SS media, FLR, neck turned, trimmed, deburred, chamfered, primer hole deburred and uniformed. A fired primer was installed and the brass was weighted with a GemPro 250 digital balance. The equipment used in the experiment can be seen in the photo.
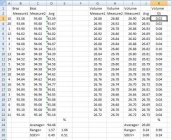
Statistics associated with the brass is in the spreadsheet on the left. The first column is the number identifier associated with each piece of brass i.e. Number 1 would be the first piece of brass I tested. Each piece of brass was weight two times (Brass Measure 1 & Brass Measure 2). The reason the identifier numbers look random is because all the data has been sorted as a function of the average weight of the brass. The reproducible of the balance is can be seen in the two values obtained in the two separate weighing. The numbers are either identical or off by a maximum of 0.06gr.
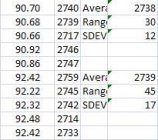
Their average weight for each piece of brass is calculated and displayed under the “Avg†column. Average overall weight was 94.48 gr with a range (ES) of 1.57 gr and a Standard Deviation (SDEV) of 0.49 gr. The range variance as expressed as percentage of average weight was 1.66% and SDEV as a percentage of average weight was 0.51%.
The tend of the variance of the LC brass can be seen in the first bar graph on the left. Interestingly there does not appear to be any particular weight that the cases gravitate towards or away from. When I sorted the data by the average brass weight and plotted it, I got a linear distribution of weights.
Next, I put each piece of brass on the balance and zero the balance. Using a color applicator (for hair - see photo), the case was partially filled with 70% isopropyl alcohol with the last part filled using the 1mL tuberculin syringe with a fine 27 gauge needle. Small volumes of alcohol was added to the case to achieve a flat meniscus. As it turns out, it was pretty easy to figure out when this happens as when the surface was either concave and convex an overhead fluorescence light reflection was visible. It disappeared when the surface was flat. Each piece of brass was filled three times and the final weighs recorded (Volume Measure 1, 2, & 3).
The average weight for each piece was calculated and ES for the three weighting calculated. As can be seen, the method worked pretty well as ES varied between 0.00 to 0.10 gr. Average overall volume was 26.80 gr with a range (ES) of 0.24 gr and a Standard Deviation (SDEV) of 0.06 gr. The range variance as expressed as percentage of average volume was 0.09% and SDEV as a percentage of average volume was 0.24%.
The tend of the variance of the amount of alcohol to fill the brass can be seen in the second graph on the right. There appears to be a linear distribution of the volumes.
Lastly, the average weight for each piece of brass was plotted against the average weight of alcohol needed to fill the same case. This is plotted in the third graph. As can be seen, there is a linear negative correlation between the two numbers i.e. the heavier the piece of brass, the less volume of alcohol it could hold. This makes sense as since the cases have been FLR, their external dimensions should be almost the same, so more brass means that it will take up more of the internal volume.
I calculated the Correlation Coefficient (R) between the two numbers. This is a statistical value that tells you how good the correlation between the two numbers. A perfect correlation gives a value of 1 or -1 (depending on positive or negative correlation), and a value of “0†means there is absolutely no correlation. The value I got from the results of the two separate experiments from two separate days was -0.85 which means that is an excellent correlation.
So in conclusion, a heavier piece of LC09 bras will hold less water, the amount of water it hold is negatively correlated to how heavy the brass is. What this means is it is at least for LC09 brass, it is not necessary to sort them by their volume but weighting them works just as well. You should of course know that this data only applies for LC09 brass and whether it works for other cases remains to be determined.
The results you see below is the sum total of two separate experiments conducted on two separate days each experiment using 10 pieces of brass. The brass used here is Lake City LC09 twice fired (by me) 223 brass that has been cleaned with SS media, FLR, neck turned, trimmed, deburred, chamfered, primer hole deburred and uniformed. A fired primer was installed and the brass was weighted with a GemPro 250 digital balance. The equipment used in the experiment can be seen in the photo.
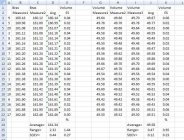
Statistics associated with the brass is in the spreadsheet on the left. The first column is the number identifier associated with each piece of brass i.e. Number 1 would be the first piece of brass I tested. Each piece of brass was weight two times (Brass Measure 1 & Brass Measure 2). The reason the identifier numbers look random is because all the data has been sorted as a function of the average weight of the brass. The reproducible of the balance is can be seen in the two values obtained in the two separate weighing. The numbers are either identical or off by a maximum of 0.06gr.
Their average weight for each piece of brass is calculated and displayed under the “Avg†column. Average overall weight was 94.48 gr with a range (ES) of 1.57 gr and a Standard Deviation (SDEV) of 0.49 gr. The range variance as expressed as percentage of average weight was 1.66% and SDEV as a percentage of average weight was 0.51%.
The tend of the variance of the LC brass can be seen in the first bar graph on the left. Interestingly there does not appear to be any particular weight that the cases gravitate towards or away from. When I sorted the data by the average brass weight and plotted it, I got a linear distribution of weights.
Next, I put each piece of brass on the balance and zero the balance. Using a color applicator (for hair - see photo), the case was partially filled with 70% isopropyl alcohol with the last part filled using the 1mL tuberculin syringe with a fine 27 gauge needle. Small volumes of alcohol was added to the case to achieve a flat meniscus. As it turns out, it was pretty easy to figure out when this happens as when the surface was either concave and convex an overhead fluorescence light reflection was visible. It disappeared when the surface was flat. Each piece of brass was filled three times and the final weighs recorded (Volume Measure 1, 2, & 3).
The average weight for each piece was calculated and ES for the three weighting calculated. As can be seen, the method worked pretty well as ES varied between 0.00 to 0.10 gr. Average overall volume was 26.80 gr with a range (ES) of 0.24 gr and a Standard Deviation (SDEV) of 0.06 gr. The range variance as expressed as percentage of average volume was 0.09% and SDEV as a percentage of average volume was 0.24%.
The tend of the variance of the amount of alcohol to fill the brass can be seen in the second graph on the right. There appears to be a linear distribution of the volumes.
Lastly, the average weight for each piece of brass was plotted against the average weight of alcohol needed to fill the same case. This is plotted in the third graph. As can be seen, there is a linear negative correlation between the two numbers i.e. the heavier the piece of brass, the less volume of alcohol it could hold. This makes sense as since the cases have been FLR, their external dimensions should be almost the same, so more brass means that it will take up more of the internal volume.
I calculated the Correlation Coefficient (R) between the two numbers. This is a statistical value that tells you how good the correlation between the two numbers. A perfect correlation gives a value of 1 or -1 (depending on positive or negative correlation), and a value of “0†means there is absolutely no correlation. The value I got from the results of the two separate experiments from two separate days was -0.85 which means that is an excellent correlation.
So in conclusion, a heavier piece of LC09 bras will hold less water, the amount of water it hold is negatively correlated to how heavy the brass is. What this means is it is at least for LC09 brass, it is not necessary to sort them by their volume but weighting them works just as well. You should of course know that this data only applies for LC09 brass and whether it works for other cases remains to be determined.