View attachment 1130974 View attachment 1130975
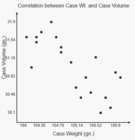
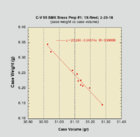
Webster - I can tell you solely by eye that the two graphs you posted (which appear to be the same graph by the way) also
strongly support a direct linear relationship between case weight and case volume. The data they contain is actually fairly representative of a good weight/volume sort. You can unquestionably see the trend of case volume decreasing as case weight increases; i.e. the best fit line of the scatterplot data has a negative slope. Here are two of many such similargraphs I have generated over the years, more or less representing "best-" and "worst-" case scenarios.
I doubt anyone will claim the relationship is
perfect. In other words, there will always be some values farther off the the trend line than others (i.e. "outliers"). Nonetheless, determination of the correlation coefficient for the best straight line plotted through any of the data sets you or I posted clearly shows a strong linear correlation between case weight and case volume. In fact, this clear linear relationship begs the question, are the outliers due to a weaker correlation between case weight and case volume, or or they more likely due to volume determination error? Having spent many decades in laboratory research where accurate liquid volumetric determination was absolutely essential, I favor the latter explanation. Accurate/precise case water volume determination is not trivial, whereas determining case weight is ridiculously simple for anyone that owns an accurate balance.
The whole reason for sorting cases by weight is an extension of the same idea; it is far simpler and faster to sort cases by weight than it is to accurately determine water volume. Again, I doubt anyone will claim the approach is
perfect, as clearly shown by the fact that there will always be some "outliers". However, even using the data provided in the two graphs you posted, it is clear that if those cases were sorted into 3 or 4 weight groups, the volume variance within any single group would be less than the volume variance of the entire set. That is exactly what weight sorting cases can achieve with minimal time and effort.
You will end up with less case volume variance in weight-sorted cases than if you did nothing at all. In other words, not
perfect, but better than not sorting at all. I can typically sort 100 cases by weight in 15-20 minutes. Sorting the same number of cases by volume would take hours if done properly.
A better illustration of what I'm talking about can be made using the brass weight versus volume graph you posted above (see below). I modified that graph to show the linear trend line (red), and the effect on volume variance of dividing those cases up into three roughly equal weight sorting groups (Low/Med/Hi, shown in blue/green/red ). The overall volume variance for all the cases is ~ 1.9 gr. Sorting the cases by weight would
reduce the volume variance within each individual weight group by ~1/3 to as much as 1/2. Sorting into 4 weight groups and/or more judicious setting of weight group boundaries would have reduced the actual case volume variance even further.
The bottom line is that sorting cases by weight can reduce case volume variance. It's not perfect, but it's relatively fast and easy, and it's better than not sorting cases at all.
View attachment 1130979


