• This Forum is for adults 18 years of age or over. By continuing to use this Forum you are confirming that you are 18 or older. No content shall be viewed by any person under 18 in California.

Velocity Flat Spots?

@Doom,

Good stuff. But then there is the error introduced by the device capturing the samples, i.e. the chronograph itself. Oehler states of their Model 35P "typical accuracy of 0.25%" (emphasis added).
-
Even when the Labradar is considered , its accuracy is 0.1% so that is +/-2.6 fps on a 308 bullet at 2600 fps.

In my analysis above I did not include any allowance for measurement system errors. The analysis includes the effects of precision errors but doesn’t include bias errors.

Precision error= reading a tape measure differently when measuring the same thing multiple time with the same tape measure.

Bias error=a tape measure were 1” doesn’t really equal 1”! A bias error doesn’t typically change with small changes in the measured variable.
There are many other variables that come into play, scale accuracy, case volume, chamber temperature, bullet weight, bullet diameter, just to name a few.
 
@Doom,

Good stuff. But then there is the error introduced by the device capturing the samples, i.e. the chronograph itself. Oehler states of their Model 35P "typical accuracy of 0.25%" (emphasis added).
-
Even when the Labradar is considered , its accuracy is 0.1% so that is +/-2.6 fps on a 308 bullet at 2600 fps.

In my analysis above I did not include any allowance for measurement system errors. The analysis includes the effects of precision errors but doesn’t include bias errors.

Precision error= reading a tape measure differently when measuring the same thing multiple time with the same tape measure.

Bias error=a tape measure were 1” doesn’t really equal 1”! A bias error doesn’t typically change with small changes in the measured variable.

There are many other variables that come into play, scale accuracy, case volume, chamber temperature, bullet weight, bullet diameter, just to name a few.
 
Accuracy of the Chrono does not matter, but it's precision (reproducibility) does. Just like using a scale. Even with an excellent load which exhibits a low SD, the single shot Chrono ladder is no better than tossing a coin to choose.
 
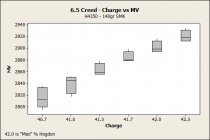
So here is a recent ladder I did on a 6.5 Creed in 0.3gr increments (Minitab "boxplots"). I can't see where the chrono data has given me anything. I will say that group 2 and group 6 showed REALLY good results on the target.

1623796774921.png
 
So here is a recent ladder I did on a 6.5 Creed in 0.3gr increments (Minitab "boxplots"). I can't see where the chrono data has given me anything. I will say that group 2 and group 6 showed REALLY good results on the target.

View attachment 1261033
How long is your barrel? Based on my experience with 29-32” barrels, your powder testing range is between the middle and high nodes. I would repeat your test starting at 39.0 grains and see what shows up over the next 2 grains.
 
So here is a recent ladder I did on a 6.5 Creed in 0.3gr increments (Minitab "boxplots"). I can't see where the chrono data has given me anything. I will say that group 2 and group 6 showed REALLY good results on the target.

View attachment 1261033
Ah. Great example. One could decide there is a 'flat spot in velocity' if they shot just one or two shots. Some shots from groups 1 and 2 could easily have the same velocity simply due to normal distribution of velocities.
 
Thanks for the responses and for the attempts at explaining the flat spot. My own belief is that the observed flat spots do not represent what is really happening. For a true flat spot to exist over a load range, it would have to be an effect equal to the magnitude of the powder charge. Doesn’t seem plausible even it multiple effects were involved.
 
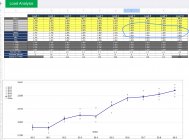
I do not know why or how velocity flat spots are created, but find them in every test that I do. I will say that it takes good brass prep and consistency in your reloading process to separate the results from the noise. Here is an example:
View attachment 1261560
If you changed the scale of your graph slightly, the whole thing would look like a flat spot - WOW! What were the powder charge increments you used for this study?
 
I do not know why or how velocity flat spots are created, but find them in every test that I do. I will say that it takes good brass prep and consistency in your reloading process to separate the results from the noise. Here is an example:
View attachment 1261560

Respectfully his is a good data set, but illustrates the problems associated with using a "canned" program for evaluation. This excel routine simply connects the dots between the velocity and charge weight, and does give the illusion that there is a "flat spot" without any statistical validation that this in fact realistic at all.

Upon evaluating this data in Minitab, the result show an expected linear effect :
Velocity = 580 + 44 X Charge Weight, R2=90%, SD of residuals = 4.3

For a flat spot to exist, then another term to represent curvature such as Charge Weight Squared would then improve the R2 and reduce the SD. BUT IT DOES NOT, meaning there is no basis to conclude there is anything beyond a straight line relationship between charge and velocity.

Thus, the danger of using canned programs which do not provide a proper evaluation of the data and is quite misleading as in this situation. Again, this is not meant as a slight to the OP but to demonstrate you cannot simply trust what a computer program shows you.
PS : In the OP excel program instead of using the connect-the-dots option, using the statistical trendline fit with polynomial order of 2 will also show no flat spot.
 
Last edited:
Respectfully his is a good data set, but illustrates the problems associated with using a "canned" program for evaluation. This excel routine simply connects the dots between the velocity and charge weight, and does give the illusion that there is a "flat spot" without any statistical validation that this in fact realistic at all.

Upon evaluating this data in Minitab, the result show an expected linear effect :
Velocity = 580 + 44 X Charge Weight, R2=90%, SD of residuals = 4.3

For a flat spot to exist, then another term to represent curvature such as Charge Weight Squared would then improve the R2 and reduce the SD. BUT IT DOES NOT, meaning there is no basis to conclude there is anything beyond a straight line relationship between charge and velocity.

Thus, the danger of using canned programs which do not provide a proper evaluation of the data and is quite misleading as in this situation. Again, this is not meant as a slight to the OP but to demonstrate you cannot simply trust what a computer program shows you.
PS : In the OP excel program instead of using the connect-the-dots option, using the statistical trendline fit with polynomial order of 2 will also show no flat spot.
@CharlieNC, could you tweak a canned program or make one publicly available so that we could run our data through it and collect enough empirical data to validate results? That would be helpful.

I’m not an engineer nor a statistician. The simplified spreadsheet above has helped me dial in 15 different barrels over the last 3 years, all producing very tight verticals at 1,000 yards (.5 MOA over 20 shot strings), and has helped me place pretty high at BSWN and Nationals. I am always looking to learn and grow my knowledge in this sport, maybe you can help me? If it is not solving for speed flat spots, what is it helping me do, which is generating great results? Thank you.
I don't use canned programs but look at every evaluation as a unique situation, and evaluate it accordingly. In the case of this data set all of the different charges exhibited an impressively low SD, so whatever you do loading wise is providing excellent results in that regard.

While I have observed excessive velocity swings at max charges, I have not found velocity to exhibit nodes as does the point of impact on the target, which have not ever correlated to velocity in my limited experience.

There appear to be two options to tight groups. One is finding a target based node, utilizing barrel harmonics, whereby the effect of poor velocity SD is minimized. The second is achieving low velocity SD, whereby being off of a harmonic barrel node is minimized. Of course a combination of the two is even better.
 
David,

I would be the last person to tell you you that you don’t have a flat spot in your data. It is obvious that you do on this test, and if you turn it into a quality load then that is great. You obviously are loading very consistent ammo. However, the sample test statistics when evaluated to project a larger population will likely show that all the loads show very good SD probability and and no one will stand out.

In my opinion, you’re loadings may be more consistent than the the testing system can differentiate. Without digging into your entire loading system, and evaluating your processes you may well be seeing testing system errors.

With the consistency that you’re data shows you may be seeing flat spots often
with 0.1gr increments. Trying to measure ~4.5 fps at 2800 fps is quite a challenge. That’s equivalent to weighing a 200 lb man to +/- .3lbs.

Regardless, it leads me to wonder if a loading concept that says pick a load and find a seating depth that yields tight groups really works! I don’t have an answer to that.

Thank you for posting your data seat.

Edit 6/22/21
 
Last edited:
David,

I would be the last person to tell you you that you don’t have a flat spot in your data. It is obvious that you do on this test, and if you turn it into a quality load then that is great. You obviously are loading very consistent ammo. However, the sample test statistics when evaluated to project a larger population will likely show that all the loads show very good SD probability and and no one will stand out.

In my opinion, you’re loadings may be more consistent than the the testing system can differentiate. Without digging into your entire loading system, and evaluating your processes you may well be seeing testing system errors.

With the consistency that you’re data shows you may be seeing flat spots often
with 0.1gr increments. Trying to measure ~4.5 fps at 2800 fps is quite a challenge. That’s equivalent to weighing a 200 lb man to +/- .3lbs.

Regardless, it leads to wonder ifa loading concept that says pick a load and find a seating depth that yields tight groups really works! I don’t have an answer to that.

Thank you for posting your data seat.
That is a very perceptive observation!
 

Upgrades & Donations

This Forum's expenses are primarily paid by member contributions. You can upgrade your Forum membership in seconds. Gold and Silver members get unlimited FREE classifieds for one year. Gold members can upload custom avatars.


Click Upgrade Membership Button ABOVE to get Gold or Silver Status.

You can also donate any amount, large or small, with the button below. Include your Forum Name in the PayPal Notes field.


To DONATE by CHECK, or make a recurring donation, CLICK HERE to learn how.

Forum statistics

Threads
164,715
Messages
2,182,968
Members
78,492
Latest member
Paulsen27
Back
Top