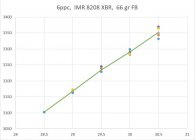
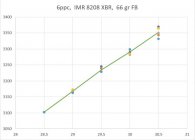
I have five different powder charges with five shots each that I would like to display in a box and whiskers sort of plot in Excel. I was able to get something to be displayed but I couldn't figure out how to assign the powder charge weight to each box. Also, I couldn't figure out how to have a line drawn between the average value in each group.
If you know how to make a reloader friendly sort of box and whisker plot would you please help?
I couldn't figure out how to get the bix'n whisker to do what I want but I came up with this:

Make sure the consecutive data for each charge is aligned vertically. I.e. one charge per column. Select data, insert chart, box plot.
I couldn't figure out how to get the bix'n whisker to do what I want but I came up with this:
...almost looks more like you want
error bars, rather than
box plots.
This site usually has some good info on visualizations.
Either way, if you provide some raw data I'm sure somebody will help you out

Minitab is your friend here.
Minitab is your friend here.
$2k per year.
Method 1: Built-In Box & Whisker Chart (Excel 2016+)
1. Arrange your data so that each category has its own column of values (e.g., Test Scores by Subject).
2. Select the entire data range, including headers.
3. Go to Insert ➔ Insert Statistic Chart ➔ Box and Whisker.
4. Excel will draw one box-and-whisker for each category, automatically calculating min, Q1, median, Q3, max, and outliers.
Use the Chart Design and Format tabs to adjust styles, colors, and add titles or axis labels. The default quartile calculation is inclusive; you can switch to exclusive via Format Data Series ➔ Series Options ➔ Quartile Calculation.
Method 2: Manual via Stacked Column Chart (Pre-2016 Excel)
When the built-in chart isn’t available, build the plot by computing key stats and plotting them as stacked columns:
1. Compute the Five-Number Summary
Let your raw data live in C5:C13.
• Min =
• Q1 =
• Median =
• Q3 =
• Max =
Place results in I5:I9.
2. Calculate Segment Heights
Below your five-number summary (I11:I15), generate differences:
• “Min to Q1” =
• “Q1 to Median” =
• “Median to Q3” =
• “Q3 to Max” =
3. Insert a Stacked Column Chart
1. Select the table I11:K15 (include category labels in column K).
2. Insert ➔ Column Chart ➔ Stacked Column.
3. You’ll see four colored segments per category.
4. Format to Box & Whisker
• Set the bottom and top segments (“Min to Q1” and “Q3 to Max”) to No Fill.
• Narrow the gap width to 50% or less for a classic box shape.
• Add error bars on the box segment (the middle two stacks) to represent whiskers if desired, using ± the appropriate values.
This manual chart then mimics a box (Q1–Q3) with median line and whiskers to min/max.
I only use it because I have access at work.
I have five different powder charges with five shots each that I would like to display in a box and whiskers sort of plot in Excel. I was able to get something to be displayed but I couldn't figure out how to assign the powder charge weight to each box. Also, I couldn't figure out how to have a line drawn between the average value in each group.
If you know how to make a reloader friendly sort of box and whisker plot would you please help?
Fancy graphs don't make the rifle shoot better. Just look at the target.
I find the box/whiskers not useful.
I use the xy scatter. Expand the chart to show the differences and I can see the results much better that way. All the shots show up, not just a statistical calculation based on a few shots. You can see true outliers and how tight the rest of the group might be.
Fancy graphs don't make the rifle shoot better. Just look at the target.
True. I look at group size and shape. But I wanted to try this:

I purchased it 10yr ago when I was consulting. A couple months ago my computer died but I was able to move the solid state drive into another computer. While Minitab was functional it would not pass the online verification check. Minitab said too bad, they did not support authentication on old versions that were purchased. I'm still pissed.
Yep, the world has moved to leased/cloud based software.
Some of the smaller companies do well at grandfathering in users from the purchase days. Others not so much.
Yup, I miss those days of uni and corporate software where they paid the bills....
BTW: R is a free open source stats package that is worth a look.
https://www.r-project.org
That's my go-to for charting any more, but given the question asked was for Excel, I answered it in context - figured the OP probably didn't want to have to learn a scripting language just to knock out a quick graph.
All the commercial stats packages could do it, but most are in the same price range anymore: $1-2k per user, PER YEAR. Way more than I'm willing to pay as a hobbyist.
When I was working I had to take some process statistics training that used minitab. I learned enough to get by. That was 10 or more years ago. For now I figured out how to get the sort of graph I was looking for.
That's my go-to for charting any more, but given the question asked was for Excel, I answered it in context - figured the OP probably didn't want to have to learn a scripting language just to knock out a quick graph.
All the commercial stats packages could do it, but most are in the same price range anymore: $1-2k per user, PER YEAR. Way more than I'm willing to pay as a hobbyist.
Consider down loading LibreOffice.
It's a free version of MSOffice.
Includes a spreadsheet, document writer, power point.
Does about 90% of what MSOffice does and very easy transition from MSOffice to LibreOffice.
Free office suite – the evolution of OpenOffice. Compatible with Microsoft .doc, .docx, .xls, .xlsx, .ppt, .pptx. Updated regularly, community powered.

www.libreoffice.org
,
I use Open Office. It has a suitable chart but you do have to setup your data specifically for that type of chart. Also have to do the statistics calculations when setting up the data.
You could set up a worksheet to do it all automatically each time you load in a set of data. Just takes a little head scratching


