• This Forum is for adults 18 years of age or over. By continuing to use this Forum you are confirming that you are 18 or older. No content shall be viewed by any person under 18 in California.

3 shot group vs ladder tests

As have a lot of other folks. Nobody has actually been able to prove their results incorrect, or produce a defensible body of data which disagrees with any of the results from these multiple houses. The only arguments against these results remain to be the same appeal to authority and post hoc ergo propter hoc fallacies - arguments without defensible evidence. A lot of bark, but we’re all waiting for someone to actually have teeth in their argument to actually bite back.

Agreed, I was just pointing out that that was among the things they were testing.
 
Conservation of energy (AKA the First Law of Thermodynamics) requires that the chemical energy combusted in the round is going to show up somewhere else.

The frustrating point I see in the empirical review is that there really should not be a linear relationship between charge weight (potential energy) and velocity. We shouldn’t see flat spots, but we also shouldn’t see linear fit either - we should see a power factor relationship.

Charge weight represents Potential Energy, that energy which is stored within the powder, and we don’t really have any reason to believe the “efficiency factor” eta, η, should change as we change powder charge (η being the percentage of the potential energy of the powder which is converted to Kinetic energy on the bullet, as opposed to heat or noise, etc), so η is expected to be and considered to be a constant. So Ke = η * Pe; Ke has a linear relationship with Pe… and Ke = 1/2 * mass * velocity^2, and we know Ke = η * Pe, so η * Pe = 1/2 * mass * v^2, with mass, η, and 1/2 being constants, we should see PE = X * v^2. A power factor relationship, whereas empirically, we measure a linear relationship. So it really SHOULD be a power factor curve, but I personally assume we are simply living in a region of the potential curves which is “zoomed in” to such a tight margin that a linear approximation is still fitting nearly perfectly to what theoretically should be a 2nd order curve.

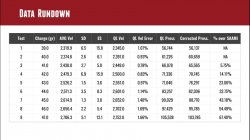
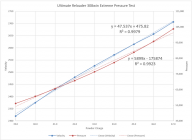
Amazingly to me, as an extreme example of this analysis: a couple of months ago for another thread online, I did this same regression on the Ultimate Reloader’s test last year where they ran 308win up over 100kpsi, and the relationship still maintained a .998 R2 value with a linear regression, for 8 grains of powder change! (Blue line below) The pressure curve did appear to be power factor proportionality, but within the region of observation, still fit .9923 R2 for a linear relationship. I had the pre-assumption that there would be a sudden obvious spike in the velocity result when crossing SOME charge weight, and that such a wide band of powder charges would start to better fit a power factor relationship instead of linear approximation, but the data still came out as a straight line.
IMG_2340.jpeg

IMG_2341.png
 
The defensible argument folks make in this conversation is that the “overlapping impacts” in small roundcount groups aren’t actually telling the story that folks want it to be telling.
People want to make it more complicated than it needs to be,
You know, I defend it with proofing the day before the match as well as using that particular charge rate to test seating along the way.
When I get 1000 yard test groups in the one’s and hold my own against some of the best tuners in the country I feel satisfied I’m on the right track.
 
in regard to turning off new shooters

What I would HOPE when new, would-be reloaders see this new information being shared online, is that they realize they do NOT have to follow whatever specific protocol folks have been trying to claim as “the best way,” and simply acknowledge that making good ammo which shoots small is a lot easier than any of these age-old methods suggest.

People want to make it more complicated than it needs to be
Bingo.

It doesn’t have to be complicated. I get messages from new reloaders frequently asking why their Satterlee curve failed, because they got a straight line and now they don’t know what charge weight to pick. I appreciate having the ability to console them by pointing to the fact this method doesn’t do what it claims, and that the straight line they shot is actually a better result. Pick a charge weight and run on targets at distance - save the bullets and barrel life for tests which matter.
 
I've shot enough OCW tests to satisfy myself in knowing that flat spots exist, and that they are repeatable. Again, I'm not here to win anyone over, change any minds, or win a nobel prize. I just find it interesting.

As do I - because it is interesting.

But if you have the data you claim to have - velocity data - which disproves the rest of the community which has published these results, it would be exceptionally interesting to finally have defensible evidence to counter the other publications.

I was absolutely convinced I had that kind of data 3 years ago, because I was absolutely certain that my flat spots were repeating and that I had enough data from re-running my “node confirmation tests” before every match to survive scientific rigor. But when I actually did the compilation, I realized the true story my data was telling me actually agreed with Litz and Neville… I ate a lot of crow that day. But I’m not too proud to admit that I thought the world was flat for a long time, and I was wrong. I would LOVE to thumb through a defensible set, as you feel you have, which actually satisfies even the most basic scientific rigor and actually proves flat spots persist in meaningful differentiation to the velocity vs. potential energy curve.
 
I've shot enough OCW tests to satisfy myself in knowing that flat spots exist, and that they are repeatable. Again, I'm not here to win anyone over, change any minds, or win a nobel prize. I just find it interesting.
Ah ha!!
You just jumped from Saterlee/Audet to OCW.
Yes I've seen minimal vertical dispersion shooting a OCW test, just as I've seen higher charges overlap lower charges in a ladder test. Which brings us back to positive compensation now that exists.

A few years back a successful LRBR shooter was sharing some tuning targets with me.
1 load in particular shot 0's ES/SD FOR 3 shots doing a ladder test, you'd think all 3 should have went into the same hole @500 yards. When in reality it was a 1.25" 3 shot group.
2 charges higher in .2gr increments so .4 gr more powder shot with the 0-ES/SD group on paper and you could've covered the group with a dime, whereas the charge .2gr more than the 0 ES/SD group had a higher POI.
So I'm not sold on flat spots, yet believe whole heartedly that Positive Compensation is real.

NEXT....
 
Wait. Are we talking about flat spots in POI or flat spots in muzzle velocity?

The thread was originally about velocity curves.

There's a brief deviation on the last page in which we discussed the fact that POI ladders tend to fall prey to the same scrutiny, but also acknowledge that folks are more willing to accept the fallibility of the Audette/Satterlee velocity curve method than of the Audette POI Ladder method, or related Newberry OCW method.
 
Ah ha!!
You just jumped from Saterlee/Audet to OCW.

Same same in regard to how the data charts out. I "load develop" both ways. I did OCW for my WSM - it's the same box of ammo, 3 strings of 10 rounds. Graphed the data and... flat spot. But I'm tired and need a nap. I think the JB Weld fumes are getting to me.
 
The thread was originally about velocity curves.

There's a brief deviation on the last page in which we discussed the fact that POI ladders tend to fall prey to the same scrutiny, but also acknowledge that folks are more willing to accept the fallibility of the Audette/Satterlee velocity curve method than of the Audette POI Ladder method, or related Newberry OCW method.
It's turned into a train wreck with lots of information being strewn all over the country side. Lol
FWIW I personally feel all the ploted graphs, ES/SD reports are excessive noise.
I believe ladders and OCW tests can be and are an aid in tuning, but the information can't be set in stone without sending a lot of expensive components down range in turn burning out that other consumable the barrel witch brings us back to the tuning table.
Vicious circle for sure!!
The whole process is subject to the angle of dispersion, just how minimal can we keep the dispersion knowing there are a multitude of variables to each loaded round being shot for record.
Believe the targets
 
the information can't be set in stone without sending a lot of expensive components down range in turn burning out that other consumable the barrel witch brings us back to the tuning table.

This is really the guiding principle for why I believe we should all critically analyze any load dev method we consider using, or are suggested to use.

If we can't prove a test actually does what folks claim it does, and we have repeating evidence in large volumes which suggest a test does NOT do what folks claim, then it seems reasonable that doing that test would be wasting expensive components and barrel life without actually bringing us closer to our goal.

Believe the targets

The big, big problem most of us experience is when this also fails, and the target lies, because we believe a target tells us something when it doesn't. It's certainly a cliche to see guys talk about shooting a cloverleaf group, "except for that one flyer I pulled out of the group," but if they shoot 10 or 20, instead of 5, the group fills everything in to include the flyer...

1751407701621.png

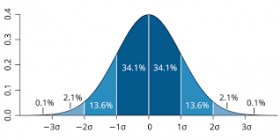
This photo tends to be the bane of our existence as shooters - especially compounding the complexity of the fact "radius from centroid" (mean radius) and "group size" both follow this distribution... Those center 68% of shots show up a lot more often than those outer 32%, more than twice as often, and of course, the center 95.4% of shots which are falling in the center ~2/3 of the possible group size make us very confident that the center-favored shots represent what the load really does, but then we question why we suddenly get a group which spits twice as wide, and we think the load slipped out of tune or fell apart... But it's just fate, coincidence, rearing her ugly head. This is why so many of our 3-5 shot groups are so stinking small, and so many of our 20+ shot groups are so much bigger. Just a matter of distribution of probabilities.
 
It sounds and looks like these charts graphs are trying to predict the weather. Sometimes it's good and "sometimes you don't need a weatherman to know which way the wind is blowing."
 
Last edited:
As do I - because it is interesting.

But if you have the data you claim to have - velocity data - which disproves the rest of the community which has published these results, it would be exceptionally interesting to finally have defensible evidence to counter the other publications.

I was absolutely convinced I had that kind of data 3 years ago, because I was absolutely certain that my flat spots were repeating and that I had enough data from re-running my “node confirmation tests” before every match to survive scientific rigor. But when I actually did the compilation, I realized the true story my data was telling me actually agreed with Litz and Neville… I ate a lot of crow that day. But I’m not too proud to admit that I thought the world was flat for a long time, and I was wrong. I would LOVE to thumb through a defensible set, as you feel you have, which actually satisfies even the most basic scientific rigor and actually proves flat spots persist in meaningful differentiation to the velocity vs. potential energy curve.

Litz and Neville also stated a 1moa rifle did not exist, and charge weight and seating depth optimization not improve accuracy. But their approach ultimately required the best group ever is required to demonstrate an improvement as compared to a test vs control approach. Such nonsense.

While my approach is steeped in data analytics, it must be appreciated that many excellent shooters can differentiate this due to extensive experience as a reference vs a standard deviation. A BR shooter has a baseline from shooting thousands of groups, and knows when something is better or worse vs that history. Likewise the ELR guys have shot thousands of ladders, and don't simply believe one test. Their reference is these numerous targets they save to study and compare.
 
It sounds and looks like these graphs are trying to predict the weather. Sometimes it's good and "sometimes you don't need a weatherman to know which way the wind is blowing."

If you can illustrate how drawing an angled line on top of a plot someone is using to find flat spots is different than the way they drew the flat lines, maybe the cynicism might be interesting.
 

Upgrades & Donations

This Forum's expenses are primarily paid by member contributions. You can upgrade your Forum membership in seconds. Gold and Silver members get unlimited FREE classifieds for one year. Gold members can upload custom avatars.


Click Upgrade Membership Button ABOVE to get Gold or Silver Status.

You can also donate any amount, large or small, with the button below. Include your Forum Name in the PayPal Notes field.


To DONATE by CHECK, or make a recurring donation, CLICK HERE to learn how.

Forum statistics

Threads
165,630
Messages
2,199,891
Members
79,028
Latest member
Stanwa
Back
Top