• This Forum is for adults 18 years of age or over. By continuing to use this Forum you are confirming that you are 18 or older. No content shall be viewed by any person under 18 in California.

Velocity Flat Spots?

There is much discussion of velocity flat spots on this and other forums. In my reading I have yet to see any post that proposes a theory as to why a flat spot should exist. Most often only limited test data is sited for its existence with no analysis.

Does anyone have an explanation as to why the flat spot should exist?
 
The first question to be asked is: “Do flat spots really exist?”

One can verify this by repeating the ladder in the charge weight range where the flat spot appears to exist. This will increase the sample size and help eliminate the possibility of statistical anomalies.

Another is to look at the variability of velocities for the entire ladder and see if the flat spot os more than a standard deviation or so from the trend.
 
I have no explanation why they would exist and I have never observed them existing in any sort of repeatable fashion

sometimes I might see them over 3 rounds or 5 rounds during "load development" but they don't return if testing at a later date
 
I'll bite.

1) The mass and metallurgical signature of a particular bullet will require a certain number of joules to deform enough to crush into the bore of the barrel. Those joules can be in two forms, heat and pressure or force whichever you prefer, and at some point on the curve of those two there will be an optimum combination that provides the most efficient deformation.
2) Based on the assumption above when the deformation is optimized it will provide the proper pressure curve to burn the selected powder in the most beneficial way for the case shape, barrel length, and bullet characteristics.
3) In the best of scenarios those two curves will have a wide area of intersection and that is your flat spot.

How's that for a SWAG. I'm sure some ballistics engineer will chime in soon and make me look foolish, but that is my normal, so all is well.
 
Last edited:
The problem I have with the idea of flat spots in velocity vs powder charge is the same as mentioned - i.e., statistically valid number of shots.

I would think at least 10 shot groups at each powder charge and, maybe, more than one 'trial'. Is there a statistician in the house?

If it were proven statistically that there are flat spots, I would imagine that the amount of powder with the given combustion chamber produces a non linear output in the pressure curve vs time. I'm imagining the pressure, temperature and gas velocity within the combustion chamber is chaotic => so small variations in starting conditions [e.g., amount of powder] could produce unexpected changes in output [e.g.., pressure curve vs time].
 
1) The mass and metallurgical signature of a particular bullet
from one engineer to, in all likelihood, another i enjoyed your hypothesis. have not run it through my 'reasonableness' filter however.

if i had known when i was 20 that i would be even mildly interested in internal ballistics a half century later i would have paid more attention in thermo and properties of materials undergrad courses. oh well, in that time span i would have forgotten it all anyway.

seems that if the response is non-linear there would be portions of the slope that are 'high gain' which amplify reloading errors of several sorts. thus sample size would have to be much larger to get accurate characteristics of the response. kind of like the 'twitchy' response some reloaders report when seating depth is juuuuussst at touch. jam a couple or jump a couple thou, but mostly stay away from the transition point.

maybe... ;)
 
It's easier to think of it as optimal burn of powder charges, think rich/lean for a carburetor mixture. I find that when the powder charges are happy the ES/SD numbers reflect that, optimal burn. Just recently working with loads for my 7mm08 I stumbled across this very thing. Every place I got awesome ES/SD numbers was where I would find a flat spot or node. Jumping .3 grains of powder in every 3 shot groups I would find 2 that would almost exactly match up with velocity and ES/SD numbers, seems the powder and primer combo seemed happy at that area... prints good on paper to.
 
Thought the flat spot was when you kept pushing the envelope until more powder didn't give commensurately more velocity.
I assumed "flat spot" meant a transient plateau at a waypoint, not near max charge, followed by a resumption of velocity increase as charge further increases. (Another common and analogous use for the term "flat spot" is in carburetor tuning, where rpm increase stalls at a partial throttle opening.)
-
 
Some concepts to consider, to help explain why you don’t see the data being asked for in this discussion.

Let’s call one the average trend line of the velocity versus powder charge, and the other one the whisker plot or box plot of the velocity along that velocity trend line. Both for a fixed case volume and seating depth, just to make the concepts simple. (When the variables of powder selections, bullet designs, primers, case volumes, seating depths, reamers, and others, are added to the discussion, you will begin to understand where this is going...)

If we just plot an average line (or single sweep line), we see non linear behavior superimposed on a sloped line of increasing velocity with charge. We call it a flat spot if the velocity plot inflects or bends down away from that common slope. For a flat spot to be useful, it would be several steps wide. Let’s say for arguments sake it is about three fourths to a full grain wide, since some folks test with tiny steps and others jump with big strides.

However, as has already been pointed out, we don’t want to kid ourselves into thinking a single sweep line, or an average line tells us the story, so we also want that box plot graph. That box plot is the one that shows us if the flat spot is also where there is a small ES or a large one, because they don’t always have to occur together.

The reason many will say that “the next time I tried to repeat that performance” and they didn’t, is that while an average trendline may show the flat spot, it will be a statistical chance that the node they were chasing sits on a narrow spot or wide spot on the box plot. A flat spot might be in a statistically noisy range where the internal ballistics and the barrel harmonics don’t line up for us.

Gas harmonics are easy to understand when the concepts are simple. Gas can resonate like any other spring, mass, damping system. If they didn’t, we would not have wind instruments. Understanding why adiabatic combustion can have a resonance or dispersion, is a much more difficult explanation for another day.

If we only cared about velocity, it would only be a matter of using a chronograph and enough samples, however, that doesn’t make us happy when we also look at precision and accuracy. Some thermodynamic resonances have harmonic behavior as the powder charge increases, but some of them are noisy. When those combine with the structural harmonics of the barrel and supports, we start to see the whole system. Hitting state of the art performance happens when those mechanical and combustion harmonics “tune” to our advantage. Finding them and getting some sort of predictable control over them is part of what this whole forum is about. But most of us don’t have a corporate or Pentagon sized budget to spend finding these nodes, not to mention fully characterizing the barrel at speeds we don’t intend to use.

The reason you don’t see many box plot graphs is the expense. Imagine burning up the components to plot fine powder steps, and then imagine the resources to plot 15 shots per powder step.

A single sweep of powder charge versus velocity (or seating depth versus vertical) can show potential nodes to investigate. Once you have your suspicions about the best ones, then going back with more samples in those places is inevitable. This is what is commonly done, as compared to the statistical thoroughness of that hypothetical full characterization.

The concept that some individual has the resources to fully characterize the behavior of a barrel to a statistical level isn’t practical or affordable since a good percentage of the barrel life can be used before all the tests are run. This type of testing means more than one “standardized” barrel would be required. Much of the resources burned would be on speeds and nodes of no interest, other than to create a study of a barrel characterization.

Even partial characterizations are very expensive. The idea of standardized barrels and chambers is part of the territory for many organizations, especially governments interested in military issues. You would find good statistical characterizations of standardized barrels in the files that are kept behind locks. It takes lots of work to produce standardized barrels, and without them there is no point to the spending it takes to characterize one since if the next one does something really different, all that work was wasted.

The budget spent on topics like rifled versus smooth bore barrels when we changed the M1 from a 105mm to a 120mm would make you sick, but the ones spent on each of those two included a full understanding of more than one type of ammunition and what it took to produce the barrels and the ammo in quantity. An M1 Abrams is nothing more than a 120mm varmint rifle rolling around on treds. It has the same characteristics as a typical varmint rifle, it just comes with a much bigger diameter. All the testing and characterization we discussed above was done with statistical rigor, but they ain’t sharing their files.

So to “see” the characterization of the barrel harmonics with respect to the question of ”flat spots” is a worthy question. The reason you can’t always have the answer you want, is the expense of showing it with statistical rigor.
 
Last edited:
Some concepts to consider, to help explain why you don’t see the data being asked for in this discussion.

Let’s call one the average trend line of the velocity versus powder charge, and the other one the whisker plot or box plot of the velocity along that velocity trend line. Both for a fixed case volume and seating depth, just to make the concepts simple. (When the variables of powder selections, bullet designs, primers, case volumes, seating depths, reamers, and others, are added to the discussion, you will begin to understand where this is going...)

If we just plot an average line (or single sweep line), we see non linear behavior superimposed on a sloped line of increasing velocity with charge. We call it a flat spot if the velocity plot inflects or bends down away from that common slope. For a flat spot to be useful, it would be several steps wide. Let’s say for arguments sake it is about three fourths to a full grain wide, since some folks test with tiny steps and others jump with big strides.

However, as has already been pointed out, we don’t want to kid ourselves into thinking a single sweep line, or an average line tells us the story, so we also want that box plot graph. That box plot is the one that shows us if the flat spot is also where there is a small ES or a large one, because they don’t always have to occur together.

The reason many will say that “the next time I tried to repeat that performance” and they didn’t, is that while an average trendline may show the flat spot, it will be a statistical chance that the node they were chasing sits on a narrow spot or wide spot on the box plot. A flat spot might be in a statistically noisy range where the internal ballistics and the barrel harmonics don’t line up for us.

Gas harmonics are easy to understand when the concepts are simple. Gas can resonate like any other spring, mass, damping system. If they didn’t, we would not have wind instruments. Understanding why adiabatic combustion can have a resonance or dispersion, is a much more difficult explanation for another day.

If we only cared about velocity, it would only be a matter of using a chronograph and enough samples, however, that doesn’t make us happy when we also look at precision and accuracy. Some thermodynamic resonances have harmonic behavior as the powder charge increases, but some of them are noisy. When those combine with the structural harmonics of the barrel and supports, we start to see the whole system. Hitting state of the art performance happens when those mechanical and combustion harmonics “tune” to our advantage. Finding them and getting some sort of predictable control over them is part of what this whole forum is about. But most of us don’t have a corporate or Pentagon sized budget to spend finding these nodes, not to mention fully characterizing the barrel at speeds we don’t intend to use.

Now that is an EXPLANATION.
Thank you sir.
 
umping .3 grains of powder in every 3 shot groups I would find 2 that would almost exactly match up with velocity and ES/SD numbers, seems the powder and primer combo seemed happy at that area... prints good on paper to.
Excactly my findings as well....final results is letting the target do the talking.
It makes for burning less components and time to find my next load for Competition.
 
How would you go about proving your observed flat spot is statistically significant, given your sampling equipment and methodology?
-
Understand that 3,5, and even 10 round sample statistics, average and standard deviation, tell you about the samples, not the larger population of rounds that are of interest. Predicting what the sample says about a larger population is a probability problem.

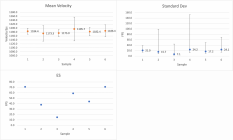
The graphs below show an analysis of some chronograph data taken recently. Its Blazer 22LR 40gr ammunition and real data. Sample one is a ten shot group with a average velocity of 1184 fps and a standard deviation of 21 fps. ES was 71. Samples 2, 3, and 4 are random 3 shot samples of ten rounds of group 1. Samples 5 and 6 are rand 5 shot groups of data from group 1. The bars reference the confidence intervals for each set of data to give a 95% probability that the true velocity and standard deviation lies within that range. You can see that the three shot groups were not nearly representative of the population they came from and that the confidence intervals are quite large. The five shot groups are closer to the average but the range for the standard deviation are still larger than the population.

So what about the ten shot group? That ten shot group predicts that the true average velocity of a larger population of shots from that lot of ammunition should be between 1170 and 1200 fps with 95% confidence and the standard deviation is between 14.5 and 38.4 fps.

Picture1.png
 
@Doom,

Good stuff. But then there is the error introduced by the device capturing the samples, i.e. the chronograph itself. Oehler states of their Model 35P "typical accuracy of 0.25%" (emphasis added).
-
 
Understand that 3,5, and even 10 round sample statistics, average and standard deviation, tell you about the samples, not the larger population of rounds that are of interest. Predicting what the sample says about a larger population is a probability problem.

The graphs below show an analysis of some chronograph data taken recently. Its Blazer 22LR 40gr ammunition and real data. Sample one is a ten shot group with a average velocity of 1184 fps and a standard deviation of 21 fps. ES was 71. Samples 2, 3, and 4 are random 3 shot samples of ten rounds of group 1. Samples 5 and 6 are rand 5 shot groups of data from group 1. The bars reference the confidence intervals for each set of data to give a 95% probability that the true velocity and standard deviation lies within that range. You can see that the three shot groups were not nearly representative of the population they came from and that the confidence intervals are quite large. The five shot groups are closer to the average but the range for the standard deviation are still larger than the population.

So what about the ten shot group? That ten shot group predicts that the true average velocity of a larger population of shots from that lot of ammunition should be between 1170 and 1200 fps with 95% confidence and the standard deviation is between 14.5 and 38.4 fps.

View attachment 1260935
Great response. However no-one believe facts any more. I believe your explaination and post #15. Bottom line is what shoots the smallest groups.
 

Upgrades & Donations

This Forum's expenses are primarily paid by member contributions. You can upgrade your Forum membership in seconds. Gold and Silver members get unlimited FREE classifieds for one year. Gold members can upload custom avatars.


Click Upgrade Membership Button ABOVE to get Gold or Silver Status.

You can also donate any amount, large or small, with the button below. Include your Forum Name in the PayPal Notes field.


To DONATE by CHECK, or make a recurring donation, CLICK HERE to learn how.

Forum statistics

Threads
164,692
Messages
2,182,551
Members
78,475
Latest member
375hhfan
Back
Top