• This Forum is for adults 18 years of age or over. By continuing to use this Forum you are confirming that you are 18 or older. No content shall be viewed by any person under 18 in California.

Standard Deviation Explanation

Finally makes sense to me after reading Labradar instructions

Cant believe it took years to understand

John

Standard deviation- A number used to tell how measurements for a group are spread out from the average, or expected value. A low standard deviation means that most of the numbers are very close to the average. A high standard deviation means that the numbers are spread out.
 
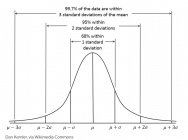
It is easy to show with a diagram of a Bell Curve. If you take the average (mean) as a centerline, a standard deviation is easy to picture if you visualize each side being split into thirds. That makes the total span of the whole bell curve six of those with three plus and three on the minus side of the average.

When you have really tight scatter, the whole bell curve is narrow, and then so is the SD. If there is a lot of scatter, then the SD is bigger. I'll try and stick a picture in here.

1642216807989.png

This diagram shows that the ends or tails is what we call the Extreme Spread and that is the same as saying 6 times the SD. That covers the whole (99.7%) bell curve.
 
Great image above. Ill add that if you have one shot far out it may not hurt a high count average but itll show up in the SD. Thats how i think of it. You could have 20 shots averaging 10 and an SD of zero or 20 shots averaging 10 but one was a 5 it will show up on SD
 
Great image above. Ill add that if you have one shot far out it may not hurt a high count average but itll show up in the SD. Thats how i think of it. You could have 20 shots averaging 10 and an SD of zero or 20 shots averaging 10 but one was a 5 it will show up on SD
Yes. You bring up a good point and reminded me to mention the next important stuff to point out.

When you see a shift in an average, we call it insignificant depending on if that shift is not at least one SD.
Also, to say something is a flyer, it should be more than 3 SDs away from the average.
 
The part that folks miss is the % of data points (shots) that can be expected to fall outside of plus or minus 1 std dev., and the % that can be expected plus or minus 2 to 3. With an adequate data set this does predict where your data will fall.
 
The part that folks miss is the % of data points (shots) that can be expected to fall outside of plus or minus 1 std dev., and the % that can be expected plus or minus 2 to 3. With an adequate data set this does predict where your data will fall.
Yes, to have good confidence in your performance, it takes enough data to get that bell curve to take shape.

When you try to predict it with too few points, you have to accept the consequences that you have high odds of being wrong.
 
STD dev is the squared sum of the difference of each data point from the mean. The squared sum is divided by the number of data points.
The square root of that whole calculation is the standard deviation.
The smaller the number, the tighter the cluster of points around the mean.
People also look at ES, extreme spread, because that demonstrates the tightness of the group, or the likeliness of a flier.
 
ES is not a reliable indicator of group size. That doesn't mean it isn't useful.

If you are limited to doing load dev at 100 yds, and you shoot a one hole group but it has a high ES, it won't likely shoot well at distance. However, the converse isn't always true. We have seen scores of one-hole 100 yd groups with tight ES and SDs that group 12" at 650 yds. So for me, a high ES at short range is just telling me what won't work.

When it comes to tuning loads at 1000 yds from LRBR rifles, the best groups usually aren't at the best ES. However, it does seem that once we get below an ES of 20 that ES isn't a factor anymore, at least to 1000 yds.

Now when the ES is over 20 fps I think I see a little correlation. I did have one hunting rifle go from 6" groups at 650 yds to a 4.375" group and the ES went from mid 30s to mid 20s.

On the other hand, I just had a rifle give me 3.25" 650 yd groups with an ES of 27, but 1/2 grain more powder opened it up an inch even though the ES was 24. In all fairness, there really isn't much difference between 3.25" and 4.25" at 650 with a lighter weight hunting rifle, and these groups are close to what the other rifle gave me with a similar ES.

Anyway, reapeated group sizes at distance are the most reliable indicator of rifle/load performance, not numbers in the chronograph.
 
It is easy to show with a diagram of a Bell Curve. If you take the average (mean) as a centerline, a standard deviation is easy to picture if you visualize each side being split into thirds. That makes the total span of the whole bell curve six of those with three plus and three on the minus side of the average.

When you have really tight scatter, the whole bell curve is narrow, and then so is the SD. If there is a lot of scatter, then the SD is bigger. I'll try and stick a picture in here.

View attachment 1307933

This diagram shows that the ends or tails is what we call the Extreme Spread and that is the same as saying 6 times the SD. That covers the whole (99.7%) bell curve.
I think there is an eq
Finally makes sense to me after reading Labradar instructions

Cant believe it took years to understand

John

Standard deviation- A number used to tell how measurements for a group are spread out from the average, or expected value. A low standard deviation means that most of the numbers are very close to the average. A high standard deviation means that the numbers are spread out.
There is an equation to calculate how many data points you need to get a certain confidence level. Sounds like you may be familiar with it. I think it's a R squared number. Can you tell use how to calculate how many shots it takes to get a high confidence number.
 
Last edited:
Chrono data is easy to look at and get an idea of the performance of a load but the proof is on the target. The Mean Radius or average of the group from the center of the points of impact is similar to “SD of the group” on paper. There is usually a correlation between low Muzzle Velocity deviation and ES, it we shoot targets and groups, not chronograph data.
 
I shoot target 1st at 1200y then look at the crono.
If you look at the vid you will see 3 shot along the bottom way back then I couldn't read wind without flags to save my life .
Then the wind dropped right out in about 10mins while I was cooling the barrel then I sent these down at 1026y
 
There is an equation to calculate how many data points you need to get a certain confidence level. Sounds like you may be familiar with it. I think it's a R squared number. Can you tell use how to calculate how many shots it takes to get a high confidence number.
https://www.calculator.net/sample-size-calculator.html

The more "noisy" your system context, the more samples it takes to get confidence in the answers, the higher your probability requirements, the higher the sample level.

For example, when doing group testing with a body-supported lightweight hunting rig, versus a straight "truck axle" bbl in a heavy vice... you might see convergence in the data of the heavy rig in a few shots, but the lightweight hunting rig might take more than five times as many shots to show you what the potential cone of fire can be.

The way to look at this is by eyeballing the size of the Standard Deviation compared to the mean. If the ratio is "tight" versus if the ratio is "loose".

If we allow the probability value to run 95%, we need fewer samples. If we demand the 99.7% probability level, we need higher sample sizes in general.

In the "high-reliability" world, some of us were forced into contract standards of reliability called "three nines five", which meant less than 5 failures out of 10,000. If you wondered why some DoD budgets were bad, that was why.... YMMV
 

Upgrades & Donations

This Forum's expenses are primarily paid by member contributions. You can upgrade your Forum membership in seconds. Gold and Silver members get unlimited FREE classifieds for one year. Gold members can upload custom avatars.


Click Upgrade Membership Button ABOVE to get Gold or Silver Status.

You can also donate any amount, large or small, with the button below. Include your Forum Name in the PayPal Notes field.


To DONATE by CHECK, or make a recurring donation, CLICK HERE to learn how.

Forum statistics

Threads
166,257
Messages
2,214,836
Members
79,496
Latest member
Bie
Back
Top