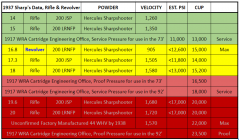
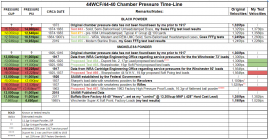
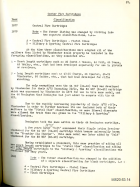
From my dedicated research and testing over the past ten years, I finally came up with a few simplified cross reference charts regarding pressures from historical data, testing data and modern data. I am by no means finished but thought I would share what I have so far. As we all know there is no magic formula to convert cup to psi and psi back to cup. However, we can do a few things with at least a few low pressure cartridges to give us a good idea of what the difference would be in a respectable range.
Using data from a 1917 dated document from WRA's Carriage Engineering Office(earliest I can find), load data from early smokeless powder cans, load data from 1930's handloading manuals, load data from modern handloading manuals, test results from using the Pressuretrace II equipment/software....I came up with the following charts.
Hopefully I can perform the proposed tests noted in the next few weeks.
(charts subject to edits without notice here)
WRA Cartridge Engineering Office Data
Sharpe's 1937 Handloading Data
CUP/PSI Cross Reference Chart
Pressure Time-Line Chart
Armature Test Results
Detailed data added to the 44-40 website here


Last edited:


