• This Forum is for adults 18 years of age or over. By continuing to use this Forum you are confirming that you are 18 or older. No content shall be viewed by any person under 18 in California.

Garmin ES/SD calculations vs Excel

Linko

Silver $$ Contributor
I shot some 5 shot groups with my Garmin C1-Pro. Except I forgot to start a new session for 1 group. I would up with a 10 shot group. I am trying to split this into two 5 shot groups.

Using these formulas in an Excel sheet, my SD is slightly off compared to what the Garmin provided. Any ideas why this is? I would like to have a formula that yields the same result.
Average velocity =Average(B1:B10)
SD = STDEV(B1:B10)
ES = MAX(B1:B10)-MIN(B1:B10)


Rifle Cartridge6 Dasher
GROUP "A"SPEED (FPS)
1​
2987.8​
2​
2984.3​
3​
2984.4​
4​
2986.4​
5​
2985.7​
XERO C1-PRO
AVERAGE SPEED2985.7
STD DEV1.3
SPREAD3.5
Rifle Cartridge6 Dasher
GROUP "A"SPEED (FPS)
1​
2987.8​
2​
2984.3​
3​
2984.4​
4​
2986.4​
5​
2985.7​
EXCEL CALCULATIONS
AVERAGE SPEED2985.7
STD DEV1.5
SPREAD3.5


(Only thing I can think is the Garmin has many more decimal places in the individual shot speeds.)
 
Bessels correction for sample set changes the formula from 1/N (total population counted) to 1/n-1 (sample set of total population)

Square root of [ (1/N) times Sigma i=1 to N of (xi-mu)^2 ]
 
@Linko - Here's what I'm referring to about SDs ... you have to be careful worrying about it with only 5 shots:

SD - All 25 - 26.6
SD - Best 5 - 8.9

2589
2627
2580
2592
2578
2625
2653
2607
2574
2653
2581
2608
2623
2639
2642
2619
2630

2594
2631
2569
2652
2615
2659
2608
2622
 
Last edited:
The reality is it doesn't matter which you use as long as you are consistent when comparing numbers. Actually the Garmin uses one method and Lab Radar uses the other. For years Excel had only one calculation and that was STdev().

The difference induced is 11% for a sample size of 10. It's significantly higher for 3 (67%) and 5 (80%). To be totally correct in the application of the two it works like this. You shoot 5 shots. The standard deviation of those shots is based on n, or 5. That is a population of 5. However, if this was a 5 shot sample from a population of 20 then the standard deviation would be based on n-1 or 4. The tools used to determine confidence intervals or used to compare means (t-test) or standard deviations (f-test) will also use n-1.

One way to understand the difference is to think of it in relation to probability. If the entire population is test the standard deviation of the population is known exactly. If the values are only from a sample of the population the standard deviation of the population is only an estimate and is subject to sampling probabilities.
 
There are multiple stddev funcitons in Excel.

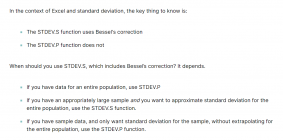
My guess is STDEV is actually STDEV.S rather than STDDEV.P, based on this:

STDDEV.S = 1.5
STDDEV.P = 1.3

The differences are explained here: https://exceljet.net/formulas/standard-deviation-calculation

View attachment 1552921
Great explanation. Is there a formula to predict accuracy based on sample size? Is there a formula in Excel to predict accuracy, something like an R squared number. 5 or 10 shots probably gives a poor accuracy for ES or STDEV. I wouldn't get hung up on small number differences comparing loads. The botton line is group size and small ES if your shooting long distance. Short range bench comp they don't worry about getting low ES. You can shoot small groups at 200 yards with an ES of 20.
 
Um I get your point, but if all you are trying to do is split those two groups up then you're making it wildly harder than you need to.
1. sync to your app
2. note that the shots are in order by date/timestamp.
3. click on each of 6-10 and exclude them, then export 1-5.
4. click on each of 6-10 and include them, then click on each of 1-5 and exclude them, then export 6-10.

How do I know this, well I made the mistake of shooting a ladder with all of each ladder in one session thinking oh I'd rather have two sessions than 20... wrong.

Yes this would be easier if the app dev person actually wrote the app to allow all this from the main menu with radio buttons, but so far they have not. I have asked for this along with a slew of other features that any app worth using should have. I'm not holding my breath, but if everyone asks Garmin to write the app like it should be... you get the idea.

I also asked them to export to excel using formulas not totals. This way when you export xx number of shots in a session you could simply delete or hide what you don't want to see and it would automagically recalculate the ES, SD, Ave, and whatever else they provide in the excel export. Why they didn't do this in the first place tells me why the app has such a poor feature set for those that actually use the data in something more than very simplistic form of view and toss.
 
Last edited:
Btw, you all posting the excel formulas above and the ins/outs of each.

Thank you!!! I've been hoping someone would do just that.
 
I wrote a utility to parse the garmin raw binary files into files that can be opened in excel and ran into the same issue trying to replicate their calculated values. Garmin stores the values to more decimal places but only outputs to a single decimal place. Using the raw values (which happens to be the stored 32 bit integer divided by 304.8), I was able to get the same SD calculations they were outputting. In the excel spreadsheet I went ahead and output SD.S and SD.P so I could compare to the labradar data I already had.
 
I shot some 5 shot groups with my Garmin C1-Pro. Except I forgot to start a new session for 1 group. I would up with a 10 shot group. I am trying to split this into two 5 shot groups.

Using these formulas in an Excel sheet, my SD is slightly off compared to what the Garmin provided. Any ideas why this is? I would like to have a formula that yields the same result.
Average velocity =Average(B1:B10)
SD = STDEV(B1:B10)
ES = MAX(B1:B10)-MIN(B1:B10)


Rifle Cartridge6 Dasher
GROUP "A"SPEED (FPS)
1​
2987.8​
2​
2984.3​
3​
2984.4​
4​
2986.4​
5​
2985.7​
XERO C1-PRO
AVERAGE SPEED2985.7
STD DEV1.3
SPREAD3.5
Rifle Cartridge6 Dasher
GROUP "A"SPEED (FPS)
1​
2987.8​
2​
2984.3​
3​
2984.4​
4​
2986.4​
5​
2985.7​
EXCEL CALCULATIONS
AVERAGE SPEED2985.7
STD DEV1.5
SPREAD3.5


(Only thing I can think is the Garmin has many more decimal places in the individual shot speeds.)
Just looked up SD info. Anything better than 2 SD is good.

Values no greater than plus or minus 2 SD represent measurements that are are closer to the true value than those that fall in the area greater than ± 2SD
 
Great explanation. Is there a formula to predict accuracy based on sample size? Is there a formula in Excel to predict accuracy, something like an R squared number. 5 or 10 shots probably gives a poor accuracy for ES or STDEV. I wouldn't get hung up on small number differences comparing loads. The botton line is group size and small ES if your shooting long distance. Short range bench comp they don't worry about getting low ES. You can shoot small groups at 200 yards with an ES of 20.
The Hornady podcast (Episode 50 or 52) about small sample size and group size measurements has a set of calculations they use to apply to group sizes smaller than 30 shots to correct for the likely true group size of the larger sample size. Litz uses the same correction based on true normal distribution of the shot radii. Essentially increasing the SD to account for missing data similar to STD Dev S vs P.
 
I might be outta line here but but ES of 3 and SD of 1.3-1.5 is outstanding at a 2900 fps MV. The sample size is way too small to be of any use to me. If you only load 5 rounds at a time, I guess this would be valid. I think the sample size should be much larger. I’m an amateur and chrono most of my shots but find I spend more time worrying about the numbers than what the target looks like and I think it makes me loose focus.
 
All good info. (i expected nothing less on this site!)

all in all the Garmin is an excellent tool making gathering shot data less of a chore and very simple & pain free.

thanks guys
 
I now chrono most of what I shoot, but I simply use it as supporting information. Like when my groups are doing something not expected I can put the chrono data next to each and much of the time it ties together well. I like seeing single digit es/sd but what happens on paper is really all I care about. I'm way early in the precision game so it's more about a learning tool for me and help me incrementally improve in areas that show up on paper.
 
I might be outta line here but but ES of 3 and SD of 1.3-1.5 is outstanding at a 2900 fps MV. The sample size is way too small to be of any use to me. If you only load 5 rounds at a time, I guess this would be valid. I think the sample size should be much larger. I’m an amateur and chrono most of my shots but find I spend more time worrying about the numbers than what the target looks like and I think it makes me loose focus.
His data for 5 shots is outstanding. But I can pretty much guarantee that if he loaded ten the SD would increase, at least most of the time!
 

Upgrades & Donations

This Forum's expenses are primarily paid by member contributions. You can upgrade your Forum membership in seconds. Gold and Silver members get unlimited FREE classifieds for one year. Gold members can upload custom avatars.


Click Upgrade Membership Button ABOVE to get Gold or Silver Status.

You can also donate any amount, large or small, with the button below. Include your Forum Name in the PayPal Notes field.


To DONATE by CHECK, or make a recurring donation, CLICK HERE to learn how.

Forum statistics

Threads
166,277
Messages
2,214,929
Members
79,496
Latest member
Bie
Back
Top